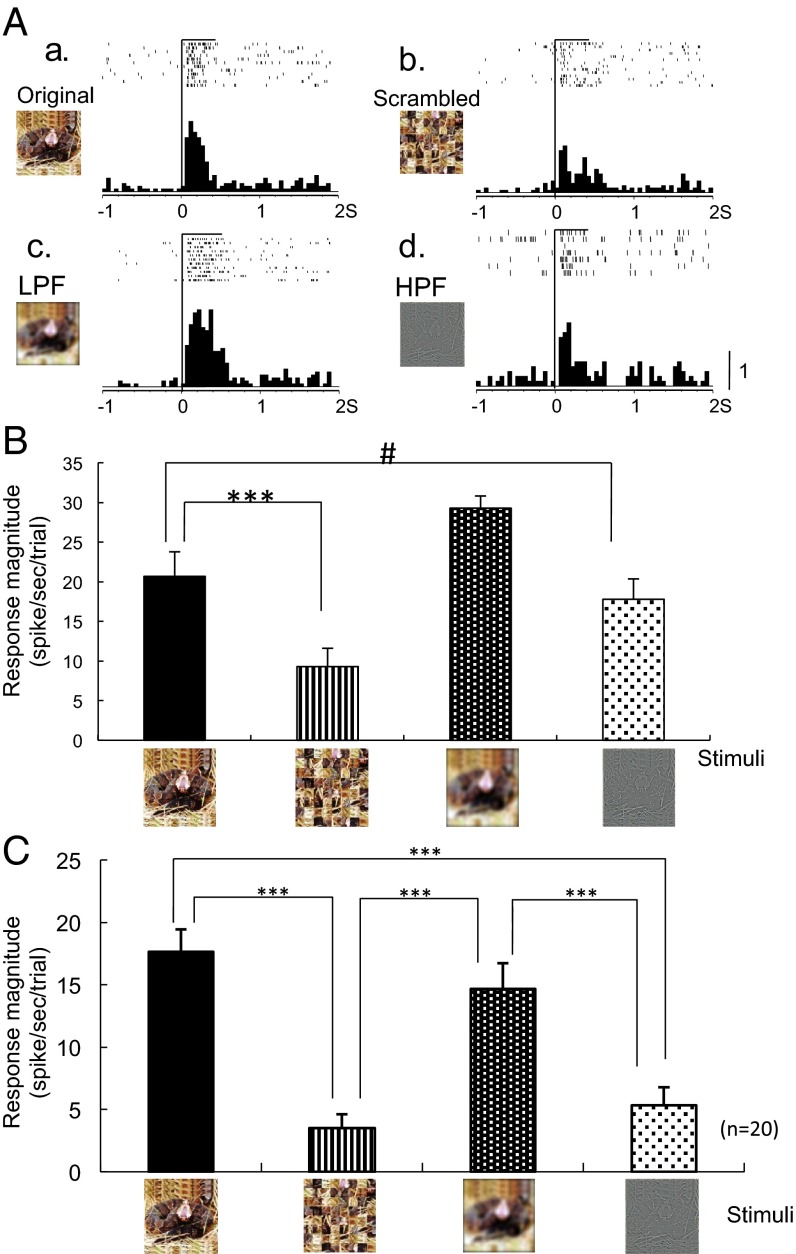
Fig. 4.
Effects of scrambling and filtering of the images. (A) An example of neuronal responses to the original (a), scrambled (b), and filtered [c (LPF), d (HPF)] images (same neuron shown in Fig. 1). (B) Response magnitudes to the stimuli shown in A. Scrambling significantly decreased (***Tukey test after one-way ANOVA, P < 0.001) and HPF tended to decrease the responses to the original image (Tukey test after one-way ANOVA, P < 0. 10). (C) Mean response magnitudes to the scrambled and filtered images (n = 20). Scrambling and HPF significantly decreased the responses to the original image (***Tukey test after one-way ANOVA, P < 0.001).

