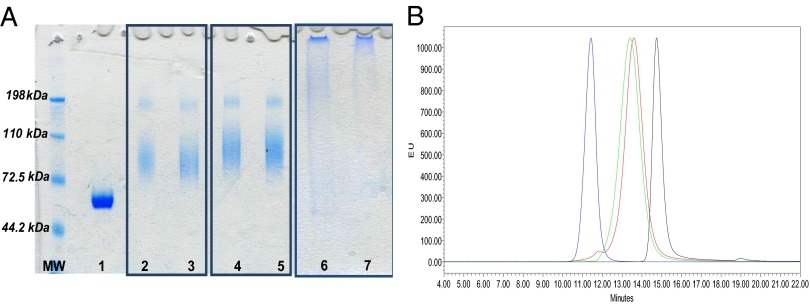
Fig. 2.
(A) SDS/PAGE analysis of CRM197 (lane 1); MenX–NH2–SIDEA–CRM197, MenX–ADH–SIDEA–CRM197, and MenXOX–CRM197 conjugation mixtures (2, 4, and 6, respectively); corresponding purified conjugates (3, 5, 7); 5 μg of protein loaded per each sample. (B) HPLC-SEC profiles (fluorescence emission) of purified MenXOX–CRM197 (blue), MenX–NH2–SIDEA–CRM197 (red), and MenX–ADH–SIDEA–CRM197 (green) in comparison with free CRM197 (black). Chromatograms were normalized with respect to y axis.

