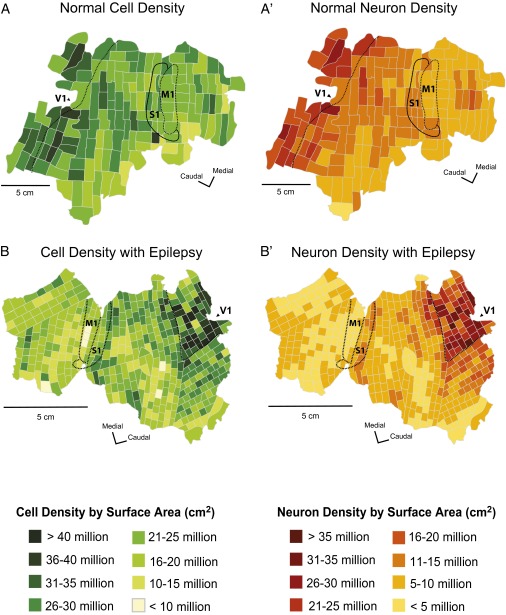
Fig. 1.
Cell and neuron density maps from a normal baboon (case 09-27) and an epileptic baboon (case 11-45). The normal cell (A) and neuron (A′) distribution in baboons shows a general caudal-to-rostral decrease in cells and neurons across the cortical sheet, with the highest cell and neuron densities located within primary sensory areas, which is consistent with findings from other primates. Epileptic baboons have consistently lower cell (B) and neuron (B′) densities relative to control. Neuron reduction appears to be regional specific with the most neuron loss observed in cortex rostral to the central sulcus, including M1.

