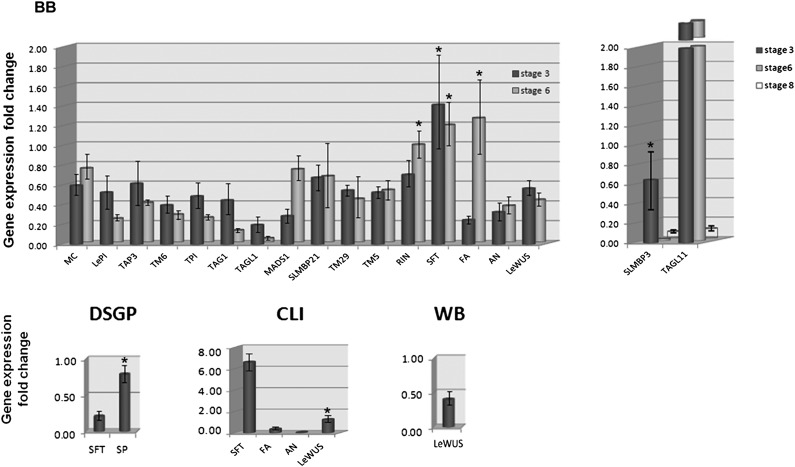
Fig. 4.
Expressions of meristem switching and floral organ identity genes in PPT phytoplasma-infected plants. Gene expression fold changes are relative to mock-inoculated controls to which a value of 1.00 was assigned. β-Actin gene was used as an internal reference. BB, big bud; CLI, cauliflower-like inflorescence; DSGP, disrupted sympodial growth pattern; WB, witches’-broom growth. The vertical bars indicate two times the value of the SD for the corresponding dataset (n = 9). Up- or down-regulations of all differentially expressed genes are statistically significant (P < 0.05). Genes that were not differentially expressed are marked with an asterisk. Refer to Table 1 for a summary of up- and down-regulation of the genes.

