Fig. 1.
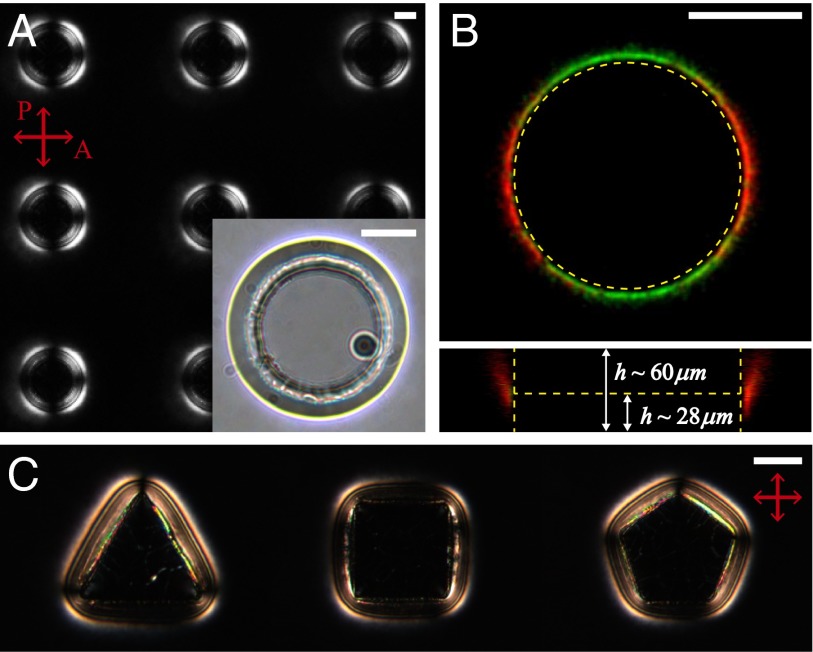
Micropost-induced bulk defect rings. (A) Polarized optical microscopy image of a micropost array where all surfaces have homeotropic anchoring resulting in defect rings that circumscribe each micropost. (Inset) Bright-field image of a single micropost where the bright line indicates the approximate lateral position of the defect loop. (B) FCPM image indicates the location of defects in an otherwise uniform director field. (Upper) Top view of the micropost. (Lower) Z-stack of FCPM images in which the maximum intensity represents the location of the defect core that occurs at approximately midheight of the post. (C) Disclination lines are dictated by the shape of the micropost as shown around triangular, square, and pentagonal microposts. (Scale bars: 50 μm.)

