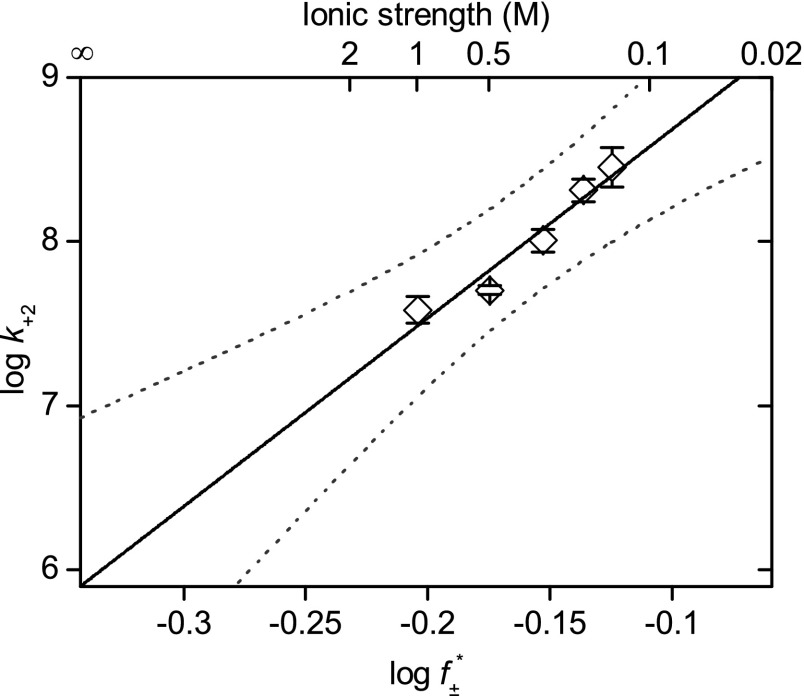
Fig. 5.
Association of Pim-1 with the αHL–PLM–TEV pore at different ionic strengths. Log k+2 (where k+2 is the second-order association rate constant) was plotted against  (where
  is the mean activity coefficient, calculated from the extended Debye–Hückel equation). At the limit [KCl] → ∞,
  , and k+2
(basal) ∼8 × 10⁵ M–1⋅s–1. Measurements were performed in 15 mM Mops, pH 6.8, with the ionic strength adjusted with KCl. The ionic strength contribution from the Mops was ∼4 mM. The applied potential was –50 mV, and the filter corner frequency was 2 kHz. Error bars represent SDs (n = 5). Dotted lines indicate the 95% prediction interval for the linear regression.

