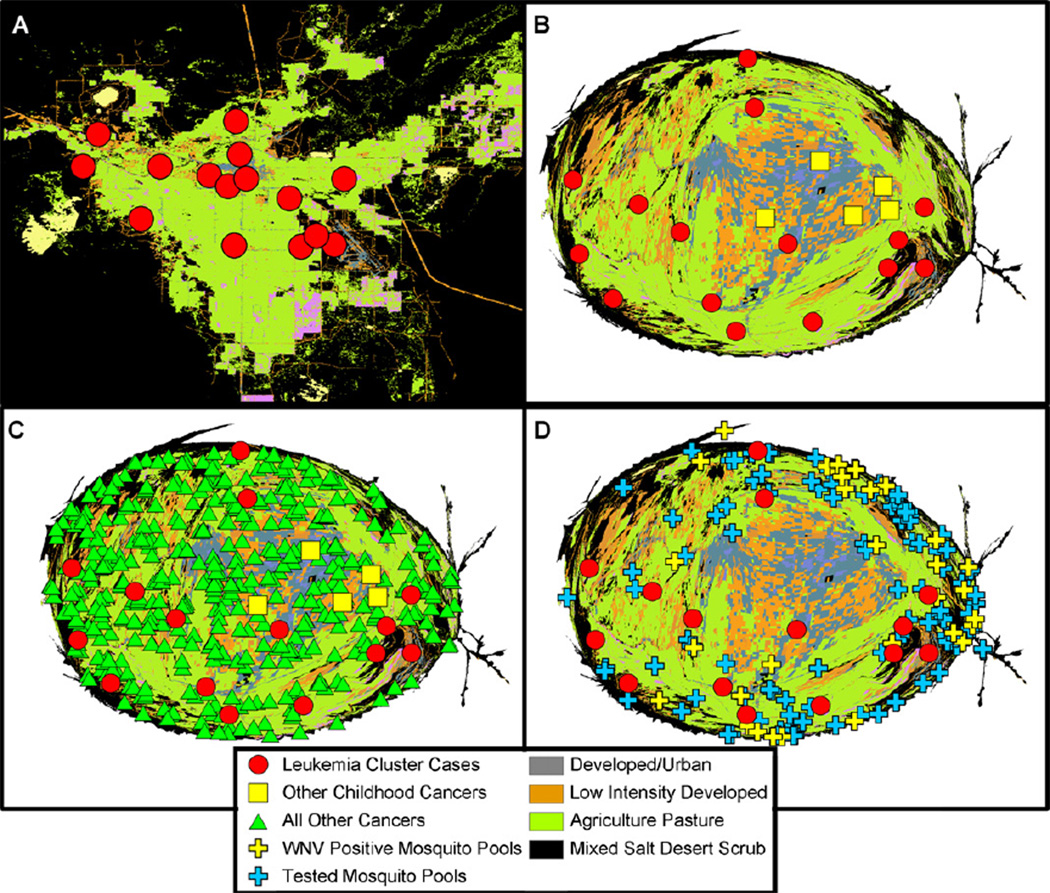
Fig. 3.
Geospatial organization of cancer cases and environmental features in Churchill County. Vegetation synthesis map of Churchill County (A) Spatial organization of leukemia cases (red circles) over the cluster time period. Locations are enlarged and “jittered” to maintain confidentiality. (B) Density-equalized map of the same information as (A), leukemia cases (red circles). Non-leukemia pediatric cancers (yellow square) are also displayed. On this map, the spatial structure is altered to create an equal distance between members of the population. (C) Location of leukemia cases (red circles), non-leukemia cancer cases (green diamonds), and non-leukemia pediatric cancers (yellow square) on the DEMP projection. Non-leukemia cancer cases appear randomly distributed. The paucity of cancer cases in the lower right of the graph is due to incomplete reporting of cancer to the Nevada registry from the US Navy Air Station. (D) Tested mosquito pools (in the year 2004) are shown by crosses, and those that were negative and positive for WNV are indicated in blue and yellow, respectively. Leukemia cluster cases are indicated (red circles).

