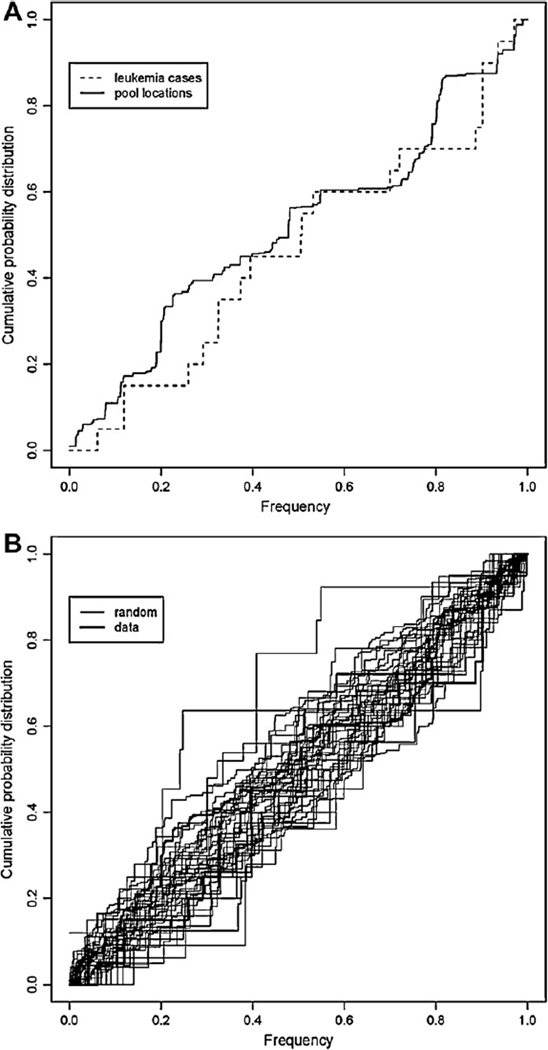
Fig. 5.
Comparison of the distribution of leukemia cases and tested mosquito pools. (A) Distribution of leukemia cases and mosquito pool testing locations. (B) Fig. 2 shows the same two cumulative distributions (thick lines) and 20 cumulative distribution functions (thin lines) created by a bootstrap sampling of the original data. The “band” of replicate distributions surrounding the data-estimated values provides a sense of the considerable sampling variation associated with these estimates. Therefore, a formal inference from comparing these two frequency distributions (plots) is simply that no evidence exists, that the two distributions differ.

