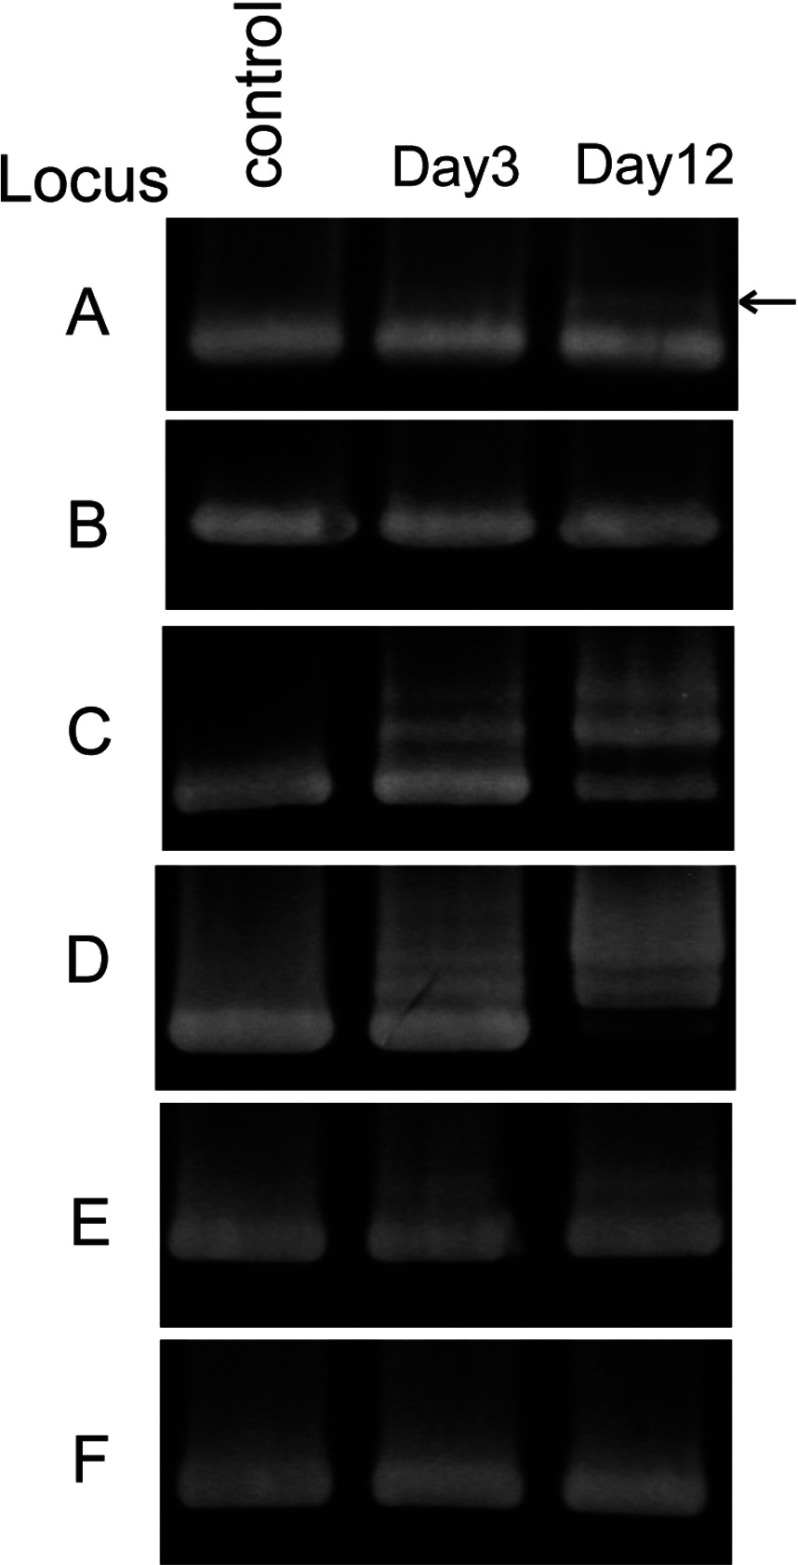
Figure 3. PCR amplification of the leader-proximal regions of CRISPR loci A to F.
The control sample shows the leader-proximal CRISPR region amplified from the uninfected wild-type S. solfataricus P2 strain. The larger amplified products visible for loci C, D and E from day 3, after reactivation of the culture from cells stored at −80°C, contain de novo spacers. A single upper band carrying de novo spacers, indicated by an arrow, was observed for locus A.

