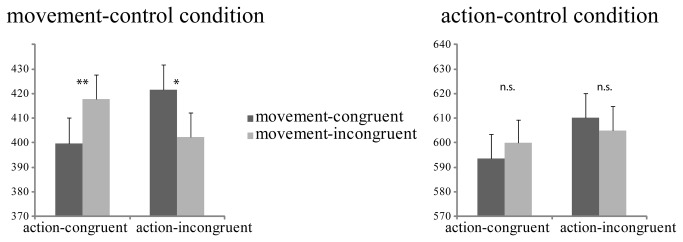
Figure 2. Participants’ mean response times in the action (conceptual)-control and movement (physical)-control conditions as a function of action (conceptual)-congruency and movement (physical)-congruency.

Error bars represent standard errors of the mean (SEM). The asterisks indicate significant differences between conditions, * = p < .05, ** = p < .005.
