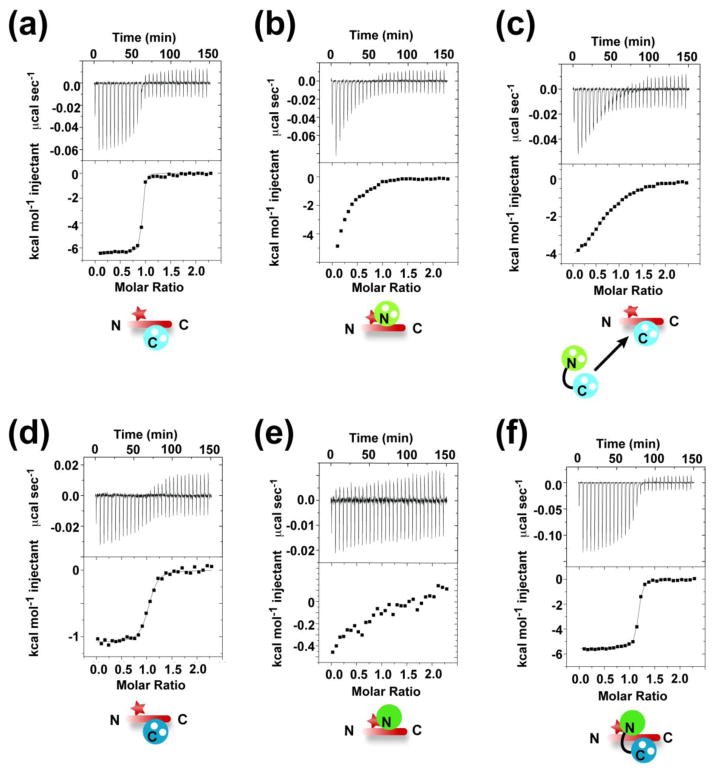
Fig. 4. Characterization of CaM and CaBP1 binding to the CaV1.2 IQ domain mutant ‘TripleA’.
Exemplar ITC titrations for: a, 75 μM Ca2+ 2:C-lobeCaM into 7.5 μM TripleA. b, 75 μM Ca2+ 2:N-lobeCaM into 7.5 μM TripleA. c, 75 μM Ca2+ 4:CaM into 7.5 μM TripleA and 50 μM Ca2+ 2:C-lobeCaM. d, 75 μM Ca2+ 2:C-lobeCaBP1 into 7.5 μM TripleA. e, 75 μM Ca2+ 2:CaBP1 into 7.5 μM TripleA. f, 75 μM Ca2+ 2:N-lobeCaM into 7.5 μM TripleA. Icons depict ITC components. N-lobes and C-lobes and are green and blue, respectively. CaM and CaBP1 are in pastel and dark shades, respectively. White spheres represent Ca2+. CaV1.2 IQ domain is shown in red. Red star signifies the TripleA mutation.

