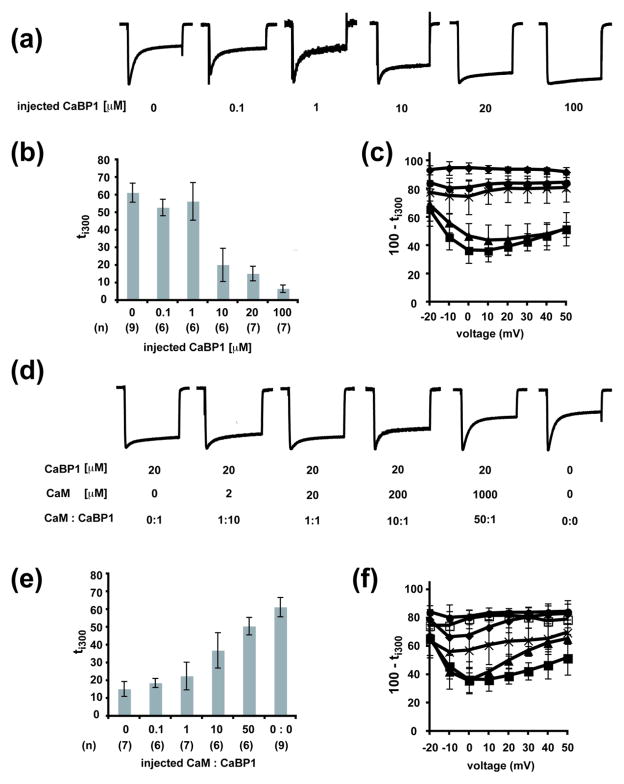
Fig. 6. Purified CaBP1 and CaM injected into cells expressing CaV1.2 compete for control of channel function.
a, Representative normalized ICa traces at a test potential of +20 mV for Xenopus oocytes expressing CaV1.2 and injected with 50 nl of the indicated concentrations of purified CaBP1 15 minutes prior to recording. b, Averaged ti300 from normalized ICa traces at a test potential of +20 mV from Xenopus oocytes expressing CaV1.2 injected with 50 nl CaBP1 protein at the indicated concentration 15 minutes prior to recording. (n) indicates the number of experiments. c, Voltage-dependence of the averaged normalized current 300 ms after channel activation (100 − ti300) from oocytes expressing CaV1.2 and injected with purified CaBP1 at the following concentrations prior to recording: 0 μM, ■; 1 μM, ◆; 10 μM,
 ; 20 μM, ●; 100 μM, ◆. d, Representative normalized ICa traces at a test potential of +20 mV for Xenopus oocytes expressing CaV1.2 co-injected with the indicated concentrations of purified CaBP1 and CaM. e, Averaged ti300 from normalized ICa traces at a test potential of +20 mV from oocytes expressing CaV1.2 and injected with purified CaM and CaBP1 at the indicated ratios. (n) indicates the number of experiments. f, Voltage-dependence of the averaged normalized current 300 ms after channel activation (100 − ti300) from Xenopus oocytes expressing CaV1.2 and injected with purified CaM and CaBP1 1 at the following concentrations prior to recording: no CaM or CaBP1, ■; 20 μM CaBP1 only, ●; 20 μM CaBP1 and 2 μM CaM, □; 20 μM CaBP1 and 20 μM CaM, ◆; 20 μM CaBP1 and 200 μM CaM,
 ; 20 μM CaBP1 and 1 mM CaM, ◆. 20 μM CaBP1 trace in panel a and its corresponding analysis in panels in b and c are reproduced in panels d, e, and f and labeled as 0 μM CaM.

