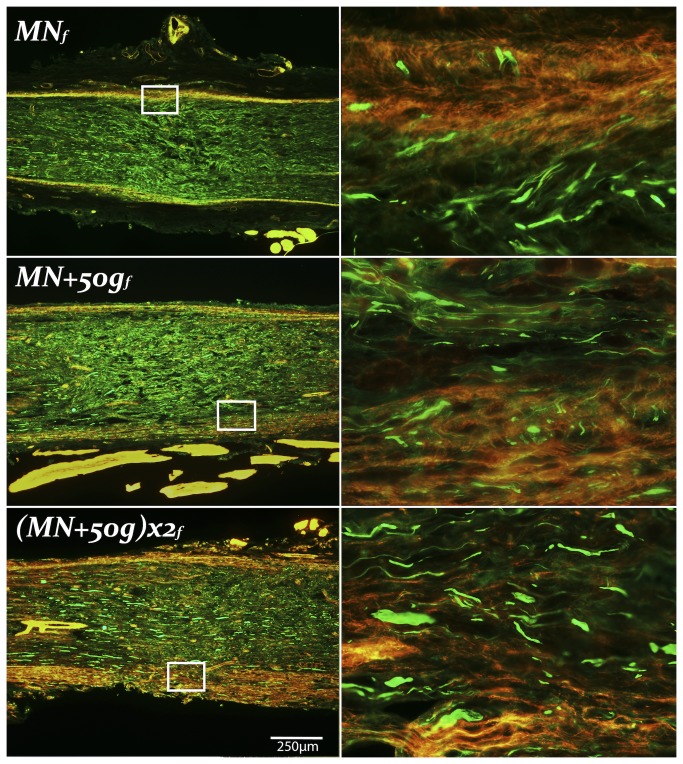
Figure 3. Neuroma formation in femoral nerve NIC groups.
Representative longitudinal femoral nerve sections of the experimental NIC groups, with magnified areas demonstrating extrafascicular regeneration on the right. MN f injury zones showed the least, and (MN+50g)x2 f (proximal injury) the most prominent NIC features. Proximal ends to the left, NF 200 in green, Rhodamine Phalloidin (f-actin) in red (250µm scale bar).

