
Figure 2. Near infrared images taken after systemic injection of ICG-loaded monocytes or ICG solution.
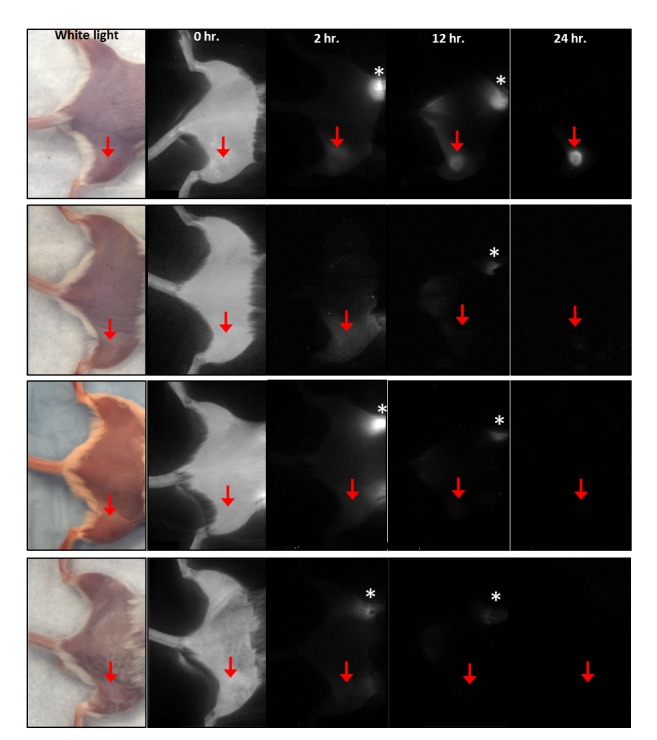
Top row: Infection model, cellular injection. Second row: Infection model, solution injection. Third row: Inflammation model, cellular injection. Fourth row: Inflammation model, solution injection. Red arrow indicates inoculation site with Complete Freund’s adjuvant in the inflammation model, or Group A Streptococcus in the infection model. Asterisk indicates ICG being excreted through the bowel.