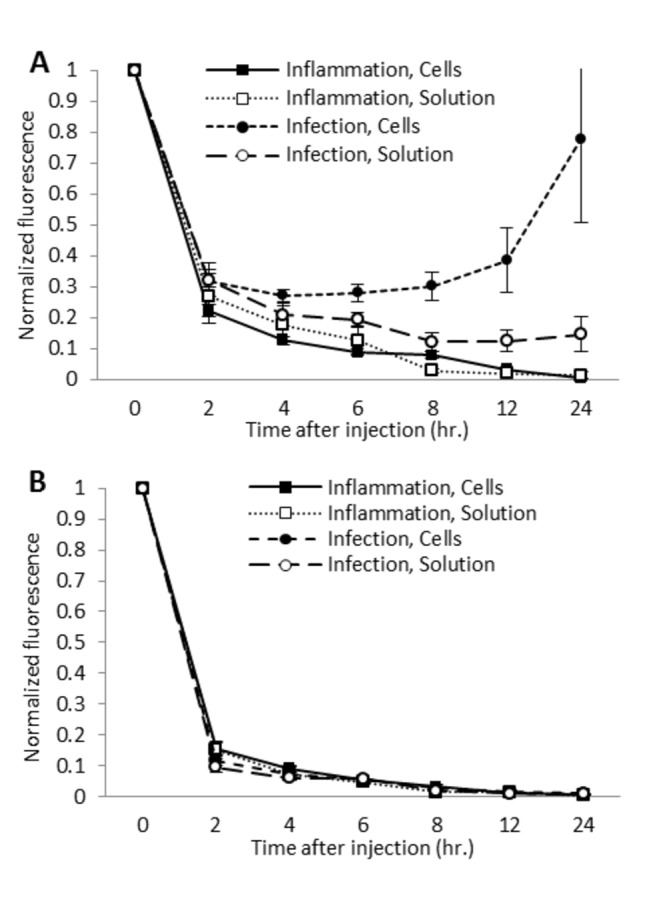
Figure 3. Normalized fluorescence for in vivo imaging of ICG labeled cells and ICG solution.

(A) Normalized fluorescence of inoculation area. Normalized fluorescence is significantly higher in the infection model (N=8) than in the inflammation model (N=8) as early as 2 hours after cellular injection (p<0.05). After injection of ICG solution, normalized fluorescence in the infection model (N=8) is significantly higher than in the inflammation model (N=8) at the 8, 12, and 24 hour time points (p<0.05). Normalized fluorescence after injection of cells was significantly higher than after injection of ICG solution from the 6 hour time point onward (p<0.05). Fluorescence intensity was normalized to the intensity at 0 hours after injection. (B) Normalized fluorescence of contralateral control area. Normalized fluorescence generally decreases throughout the study in all groups (N=8 each). All error bars represent SEM.
