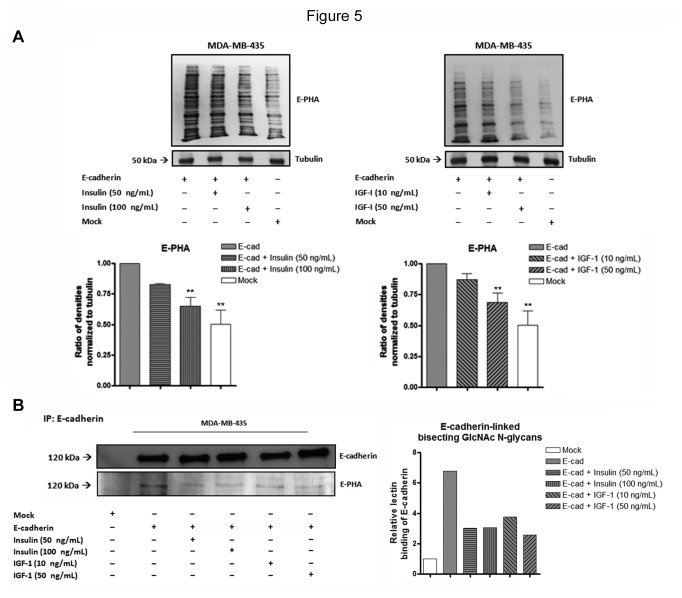
Figure 5. Effects of insulin and IGF-I stimulation on the expression levels of bisecting GlcNAc N-glycans, in general and specifically on E-cadherin.
(A) Total cell lysates from MDA-MB-435+mock, MDA-MB-435+E-cad and MDA-MB-435+E-cad stimulated (24h) with insulin or IGF-1 were obtained and analyzed by Lectin blot for E-PHA. The bar graphs show the relative amount of bisecting GlcNAc N-glycans levels in the whole protein lysate. MDA-MB-435+E-cad cells stimulated with insulin (100 ng/mL) and IGF-I (50 ng/mL) showed a significant decrease of the overall levels of bisecting GlcNAc N-glycans. The values were normalized to tubulin. Error bars indicate the means + S.E.M. (n = 3). ** = P < 0.01 ANOVA test. (B) Total cell lysates from MDA-MB-435+mock, MDA-MB-435+E-cad and MDA-MB-435+E-cad stimulated (24h) with insulin or IGF-1 were obtained and immunoprecipitated using E-cadherin antibody. The immunoprecipitates were analyzed by Western blot for E-cadherin and Lectin blot for E-PHA. The bar graphs show the relative amount of E-cadherin-linked bisecting GlcNAc N-glycans levels. Activation of insulin and IGF-I signaling pathway led to a decreased modification of E-cadherin with bisecting GlcNAc N-glycan structures.

