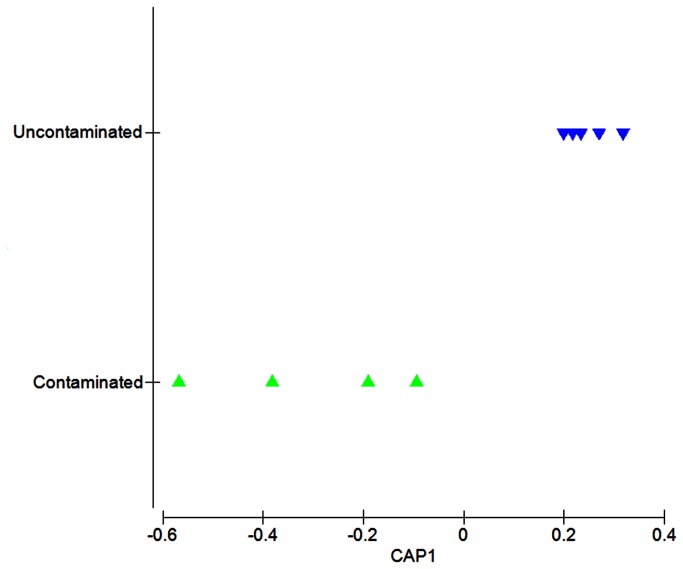
Figure 2. Comparison of hydrocarbon-impacted samples (green) and non-hydrocarbon-impacted samples (blue).
CAP analysis (using m = 1 principal coordinate axes) is derived from the sum of squared correlations of DNA fragments matching the subsystems database, level hierarchical system 1 (BLASTX E-value < E<1×10⁻⁵). Significance P = 0.008 and the first axis explained δ2 = 0.83 of the total variation. See Table S1 in File S1 for the provenance of samples included in this analysis.

