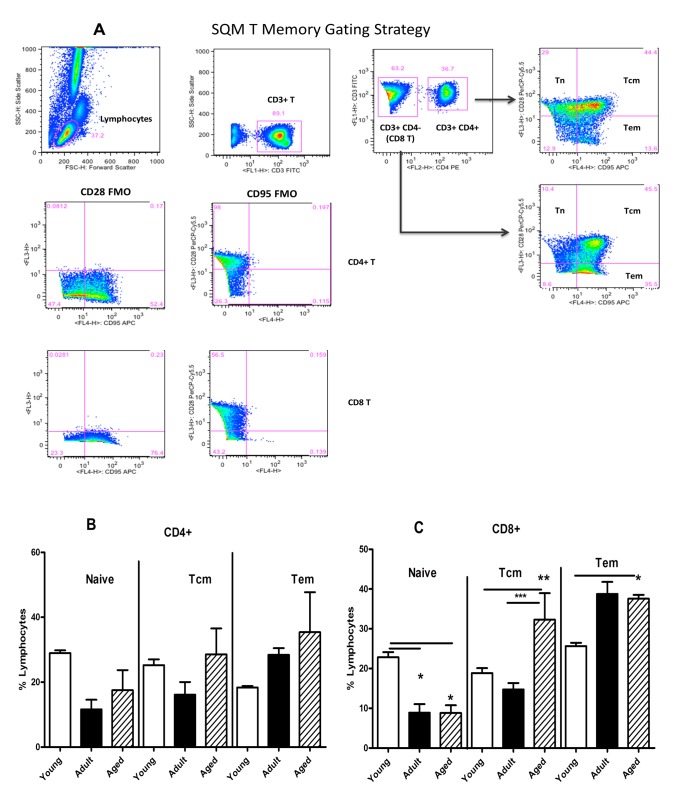
Figure 2. Phenotypic analyses of memory T cell subpopulations.
(A) Gating scheme for the analyses of the different T cell subsets in the peripheral blood from a representative animal. The lymphocytes were first gated based on forward scatter (FCS) versus side scatter (SSC), and then live lymphocytes were identified based on SSC and live population (the later based on Aqua Live/Dead reagent (Invitrogen, Carlsbad, CA). The T cells were then positively identified by CD3 expression followed by the detection of the CD4+ CD8− (CD4+ T cells) and CD4− CD8+ (CD8+ T cells) populations within the CD3+ T cells. On the basis of CD28 and CD95 expression, the CD4+ and CD8+ T cells were further differentiated into naive (Tn CD28+ CD95−), central memory (Tcm CD28+ CD95+) and effector memory (Tem CD28− CD95+) subsets. The specificity of staining for the different markers is ascertained based on fluorescence minus one (FMO) controls shown and as described in the methods section. Blood samples from the three different age groups of squirrel monkeys were stained, and analysed for T cell subpopulations by flow cytometry as described in the methods section. Percentages of naïve (CD28+ CD95−), central memory (CD28+CD95+), and effector memory (CD28−CD95+) subsets of CD4 (B) and CD8 T cells (C) were compared between the three different groups. The results shown are average of 10 monkeys in each group and P<0.05 was considered statistically significant.

