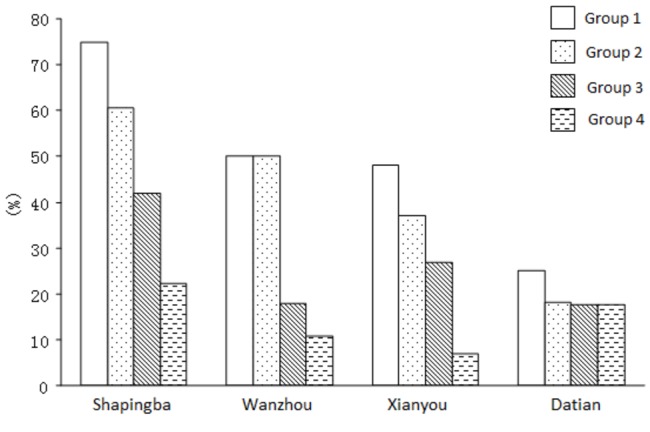
Figure 1. Proportion of subsidized patients in different income groups.

Quartiles (P25~P75) of household income per capita were applied from the poorest 25 percent (Group 1) to the richest 25 percent (Group 4).

Quartiles (P25~P75) of household income per capita were applied from the poorest 25 percent (Group 1) to the richest 25 percent (Group 4).