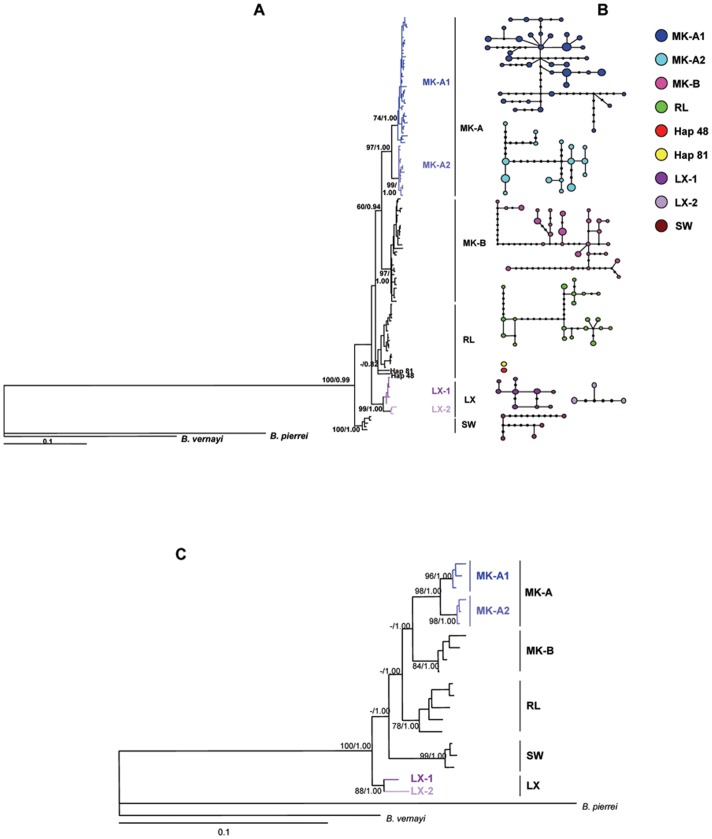
Figure 1. Phylogenetic trees reconstructed based on mitochondrial control region sequences of all haplotypes (A), the combined sequences of 20 haplotypes (C), and the haplotypes network analysis of the 126 haplotypes (B).
(A) ML tree reconstructed based on mitochondrial control region sequences of all haplotypes under HKY+I+G model. Numbers on major nodes represents bootstrap values after 1,000 replications. If bootstrap values were less than 50%, they were defaulted. Trees were rooted by H. pierrei and one H. vernayi. (B) Haplotypes networks conducted based on the 126 haplotypes. Circle size is proportional to haplotype frequency. The number of black dots on line connected haplotypes represents mutation steps between haplotypes; when the mutation step is 1, it was defaulted. (C) 50% majority-role consensus tree inferred from ML and Bayesian analysis of combined sequences of 20 haplotypes under GTR+I+G model. Numbers at nodes represent the posterior probability for Bayesian analysis and bootstrap value for maximum likelihood (ML) analysis. If the bootstrap values were less than 50%, they were defaulted. Trees were rooted by H. pierrei and one H. vernayi.

