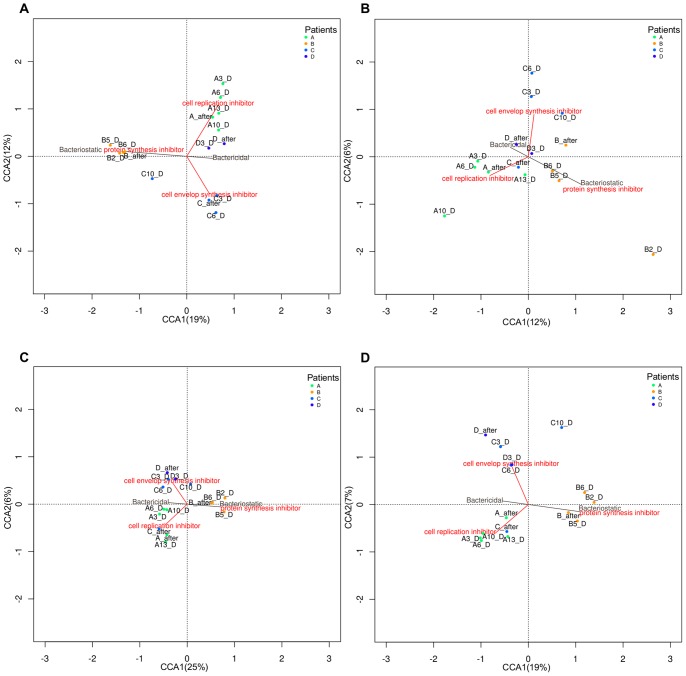
Figure 3. Canonical Correspondence Analysis (CCA) of the patients A, B, C and D in the follow-up study.
(A) total microbiota, (B) active microbiota, (C) genes and (D) gene taxonomy. The antimicrobial effect is represented as a vector with two levels (bactericidal and bacteriostatic). The mode of AB action is represented as a vector with three levels (cell envelop synthesis inhibitor, cell replication inhibitor and protein synthesis inhibitor).

