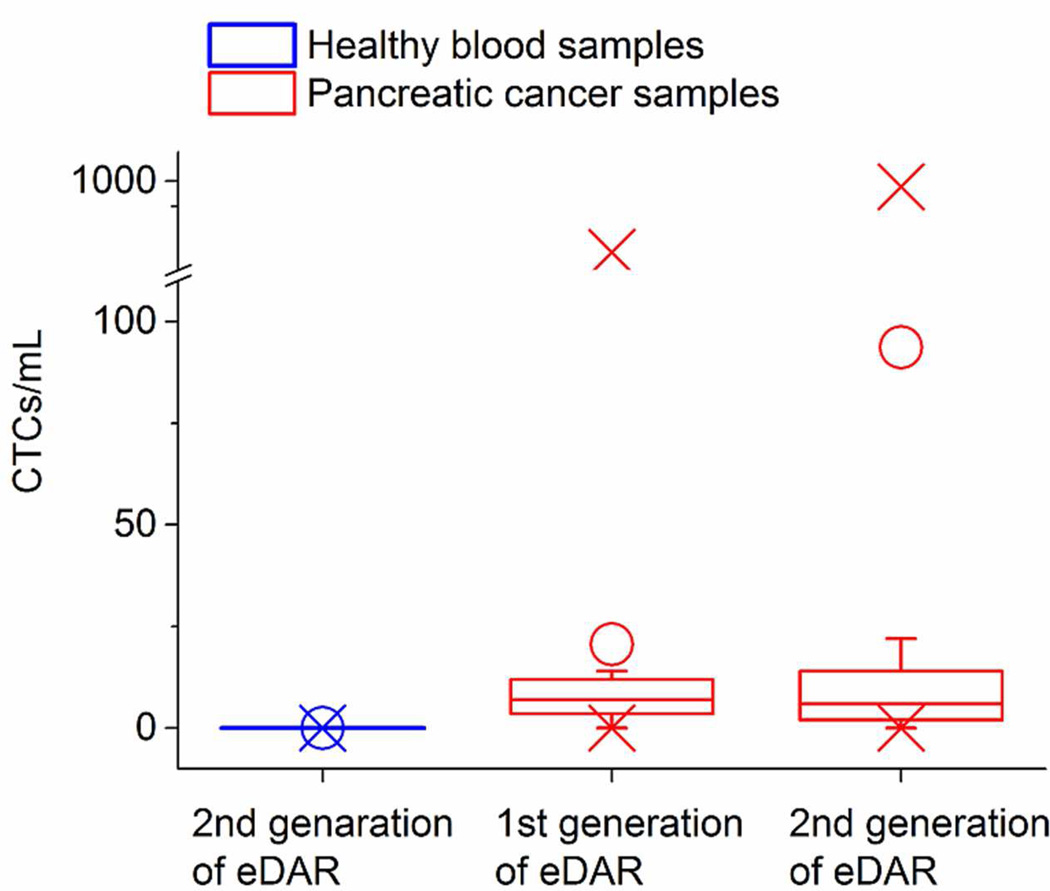
Figure 4.
The distribution of 15 control samples and 10 pancreatic cancer samples analyzed by the method reported here, as well as the distribution of 16 pancreatic cancer samples analyzed by the first generation of eDAR. O shows the average values for each data set; X shows the minimum and maximum values we found in each data set.

