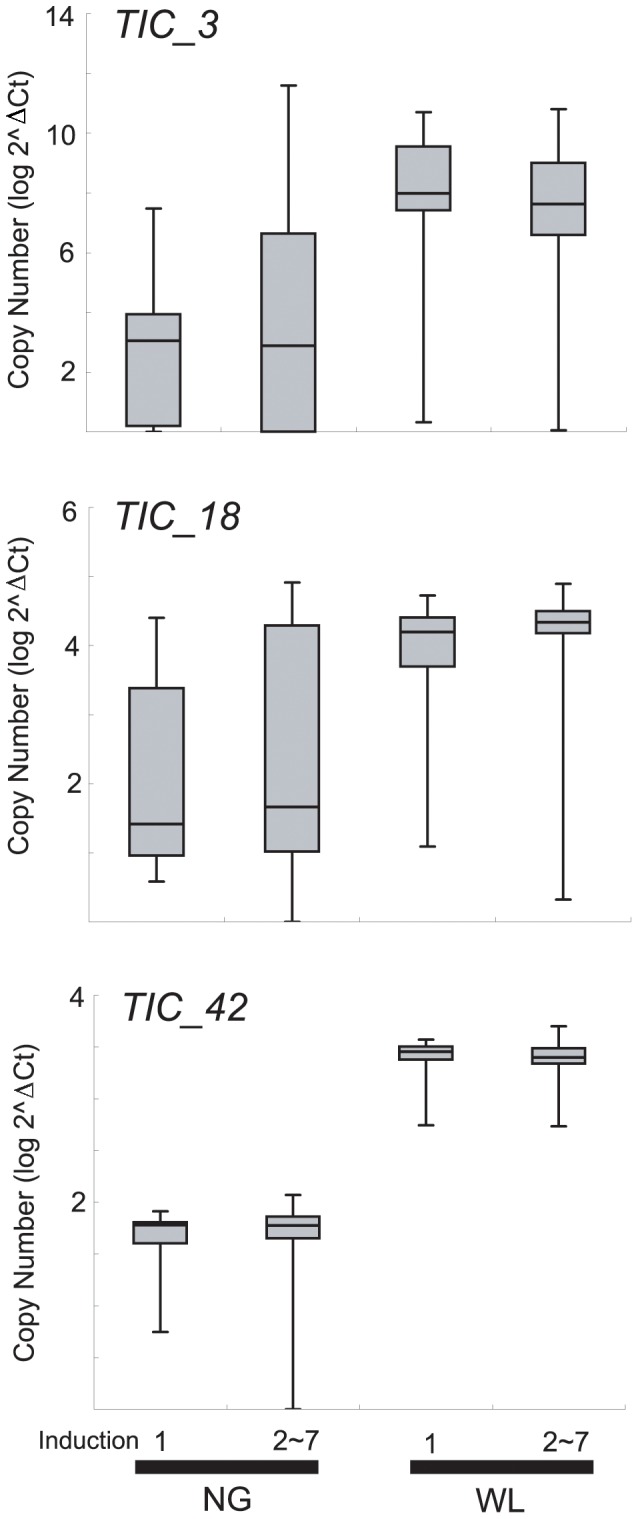
Figure 2. Comparison of relative copy number between chicken breeds with different sensitivity to fear.

Relative copy number is calculated as log2ΔCt, where ΔCt = Ctβ-actin – Cttarget. NG and WL indicate Nagoya and White Leghorn, respectively. The number of samples in each group was; n = 13 (NG; TI induction 1), n = 58 (NG; TI induction 2∼7), n = 13 (WL; TI induction 1), and n = 26 (WL; TI induction 2∼7).
