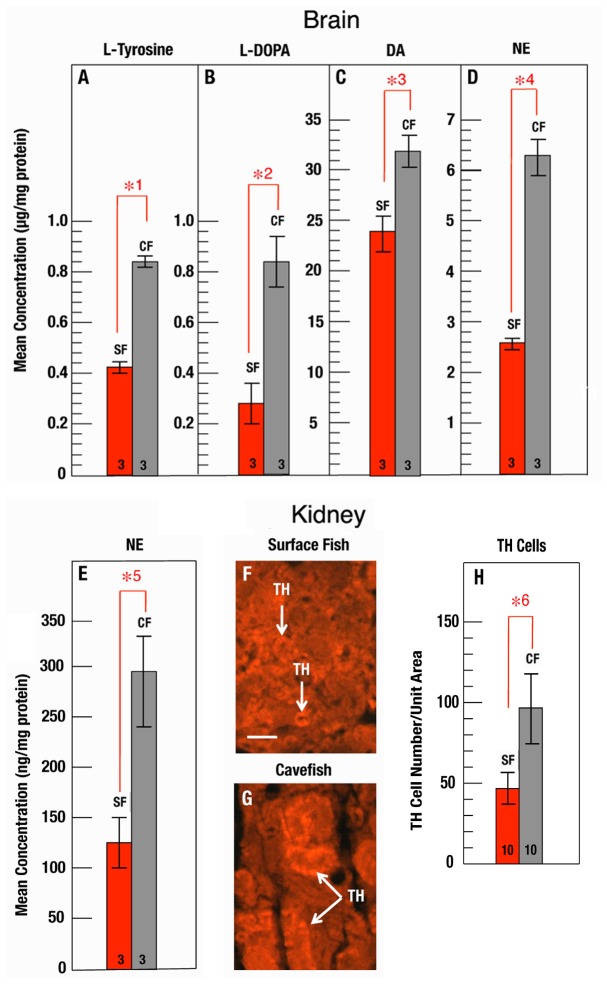
Figure 3. L-Tyrosine, L-DOPA, and CAT levels in adult brains and kidneys.
A-D. L-tyrosine (A), L-DOPA (B), DA (C), and NE (D) levels were determined by HPLC of lysates prepared from isolated surface fish (red bars) and cavefish (gray bars) brains. E. NE levels were determined by ELISA of lysates prepared from isolated surface fish (red bar) and cavefish (gray bar) kidneys. Immunostaining of sectioned surface fish (F) and cavefish (G) kidneys with TH antibody shows NE containing cells (arrows) in cavefish and surface fish. Scale bar: 10µm. H. Quantification of TH-staining cells in sections of surface fish (red bar) and cavefish (gray bar) kidneys. N is shown at the base of each bar. Errors bars: standard deviation. Statistical analysis was done using Student’s t text with significant differences depicted by red brackets with numbered asterisks. *1: p = 0.000. * 2: p = 0.011. *3: p = 0.021. *4: p = 0.000. *5: p = 0.003, and *6: p = 0.000.

