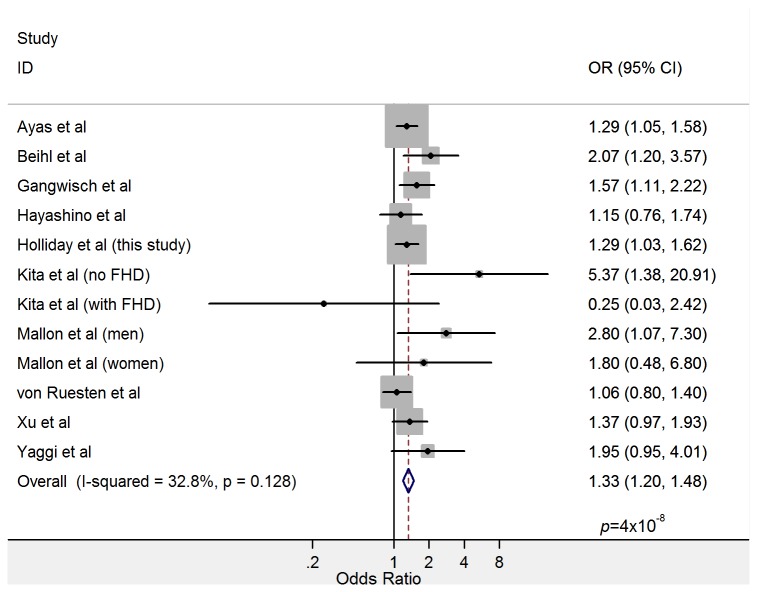
Figure 2. Forest plot showing the relationship between short sleep and incident diabetes in a meta-analysis of prospective studies including 447,124 total participants.
Point estimates and 95% confidence intervals are shown as black circles and solid lines, respectively. Grey rectangles indicate the relative weight assigned to individual studies reflecting sample size. Heterogeneity metrics and the summary estimate are shown in the final rows.

