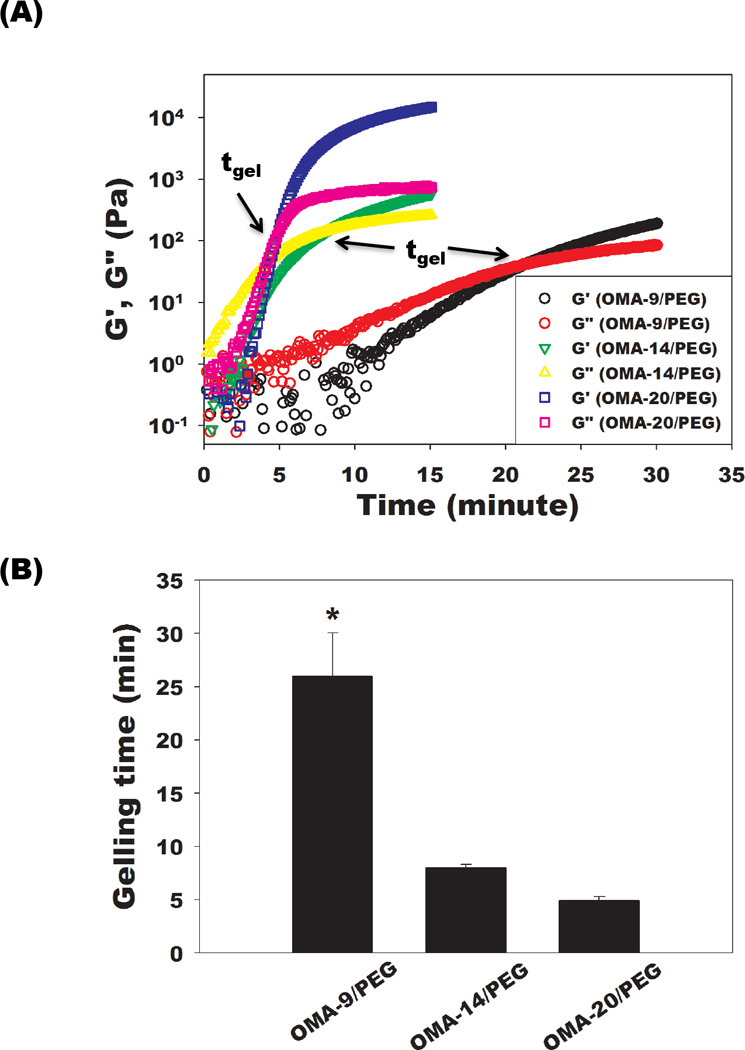
Figure 2.

(A) Representative storage moduli (G’) and loss moduli (G”) over time and (B) quantification of gelling time for the single-crosslinked OMA/PEG hydrogels at 25 °C. The time where G’ and G” crossover occurred is denoted tgel (gelling point). Values represent mean ± standard deviation (N=3). *p<0.05 compared with the other groups.
