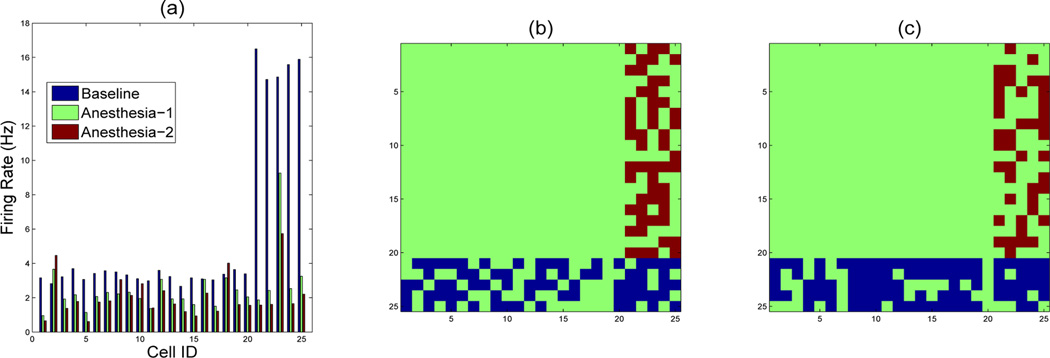
Fig. 2.
The average firing rates of selected 25 cells (a) and the synaptic connectivity maps that were used to generate spike trains during baseline (b) and general anesthesia (c). Cells #1–20 are pyramidal cells, and Cells #21–25 are interneurons. Anesthesia-1 and Anesthesia-2 are two simulated conditions with the same network connectivity but different firing rates.

