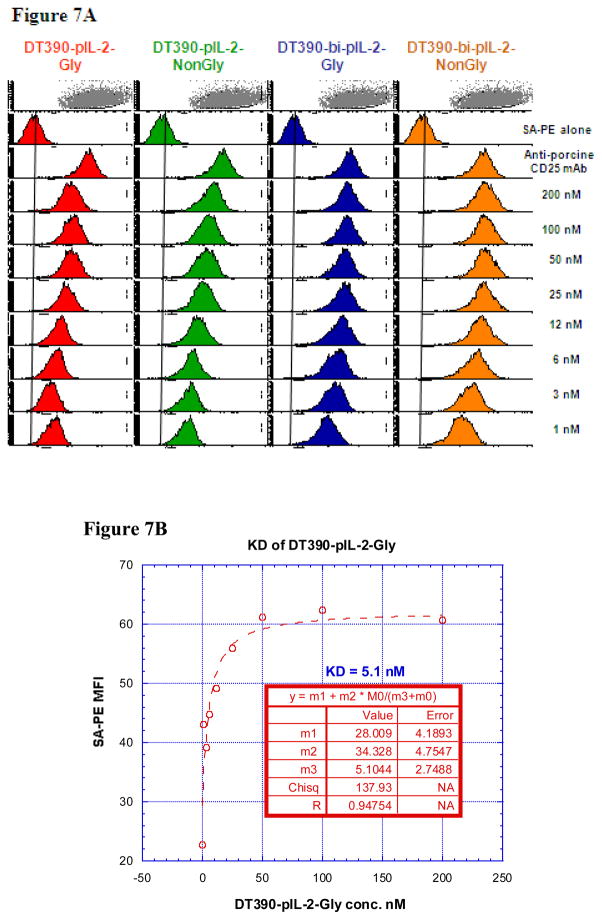
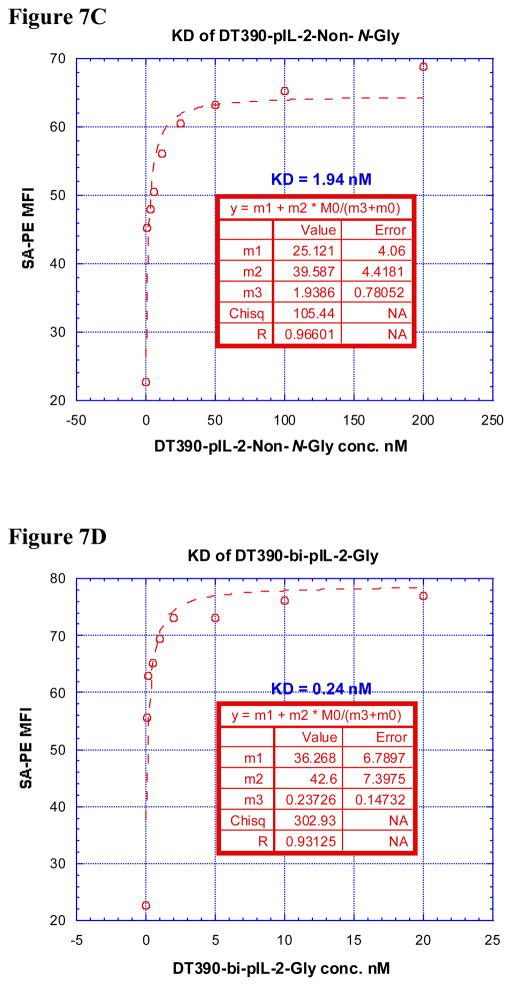
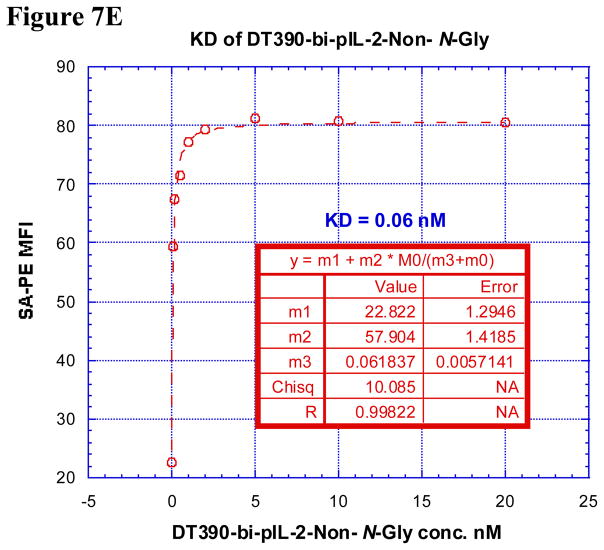
Figure 7.
A) Binding analysis using flow cytometry of biotinylated DT390-pIL-2-Gly (left panel), DT390-pIL-2-Non-N-Gly (middle left panel), DT390-bi-pIL-2-Gly (middle right panel) and DT390-bi-pIL-2-Non-N-Gly (right panel) to porcine CD25+ LCL 13271 cells (B-cell lymphoma cell line). Cells incubated with only the secondary reagent (PE-conjugated streptavidin) served as a negative control and biotinylated anti-porcine CD25 mAb (Clone 231-3B2) was used as a positive control. The data are representative of multiple individual experiments. B–E) KD Determination Using Flow Cytometry and Nonlinear Least Squares Fit. MFI was plotted over a wide range of concentrations of biotinylated B) DT390-pIL-2-Gly, C) DT390-pIL-2-Non-N-Gly, D) DT390-bi-pIL-2-Gly and E) DT390-bi-pIL-2-Non-N-Gly. The accompanying least-squares fits and parameters are shown based on the hyperbolic equation y = m1 + m2 * m0/(m3 + m0) where y = MFI at the given biotinylated porcine IL-2 fusion toxin concentration, m0 = biotinylated porcine IL-2 fusion toxin concentration, m1 = MFI of zero biotinylated porcine IL-2 fusion toxin control, m2 = MFI at saturation and m3 = KD. The inset table in B) shows a fitted KD of 5.1 nM for DT390-pIL-2-Gly. The inset table in C) shows a fitted KD of 1.94 nM for DT390-pIL-2-Non-N-Gly. The inset table in D) shows a fitted KD of 0.24 nM for DT390-bi-pIL-2-Gly. The inset table in E) shows a fitted KD of 0.06 nM for DT390-bi-pIL-2-Non-N-Gly.


