
Figure 2.

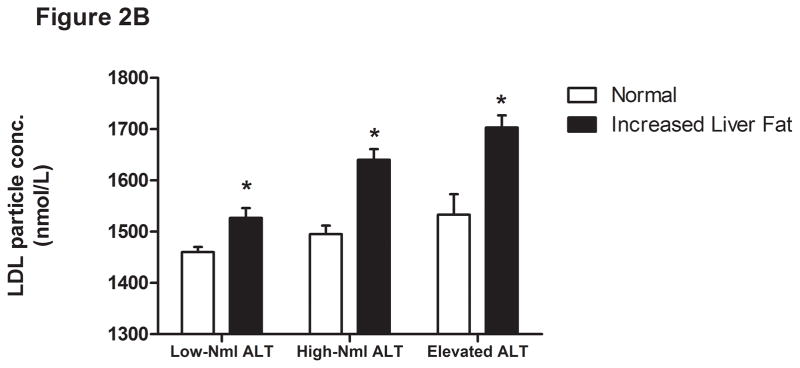
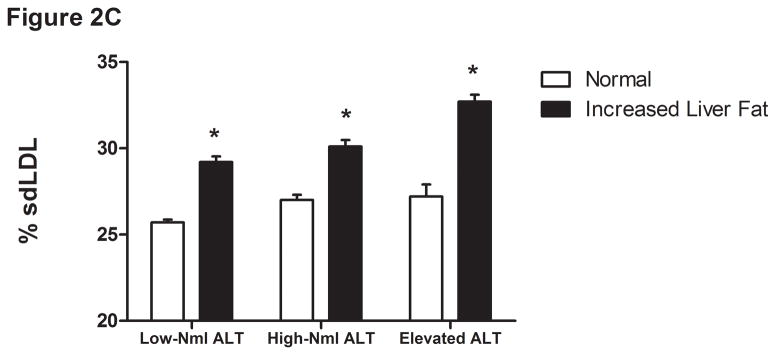

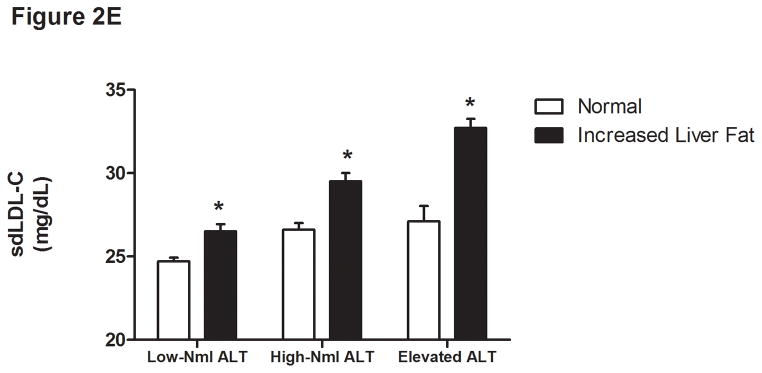

Liver fat score progressively increase from lowest ALT quartile (Q1) to the highest ALT quartile (Q4) (Figure 1A). LDL particle concentration (Figure 2B), % small dense LDL cholesterol (Figure 2C), VLDL size (Figure 2D), and small density LDL-cholesterol (Figure 2E) are increased in individuals with elevated liver fat across the three ALT groups. HDL-subclass 2 cholesterol (Figure 2F) is lower in individuals with increased liver fat scores. Low-normal (Low-Nml) ALT defined as ALT < 19 U/L in women and < 31 U/L in men, elevated ALT is defined as ALT > 40 U/L and high-normal (High-Nml) is any ALT values between these two groups. All data represented as means ± S.E.M. (*P <.001 between normal and increased liver fat)