Abstract
Background
Urine albumin-creatinine ratio (ACR) and protein-creatinine ratio (PCR) are important markers of kidney damage and are utilized for prognosis in persons with chronic kidney disease (CKD). Despite how commonly these measurements are done in clinical practice, relatively few studies have directly compared the performance of these two measures with regard to associations with clinical outcomes, which may inform clinicians about which measure of urinary protein excretion is best. We studied the association of ACR and PCR with common complications of CKD.
Study Design
Cross-sectional study.
Setting & Participants
3,481 participants with CKD in the Chronic Renal Insufficiency Cohort (CRIC) study.
Predictors
ACR and PCR.
Outcomes
We examined the association between ACR and PCR with measures of common CKD complications: serum hemoglobin, bicarbonate, parathyroid hormone, phosphorus, potassium and albumin.
Measurements
Restricted cubic spline analyses adjusted for estimated glomerular filtration rate (eGFR; calculated by the MDRD [Modification of Diet in Renal Disease] Study Equation) were performed to study the continuous association with our predictors with each outcome.
Results
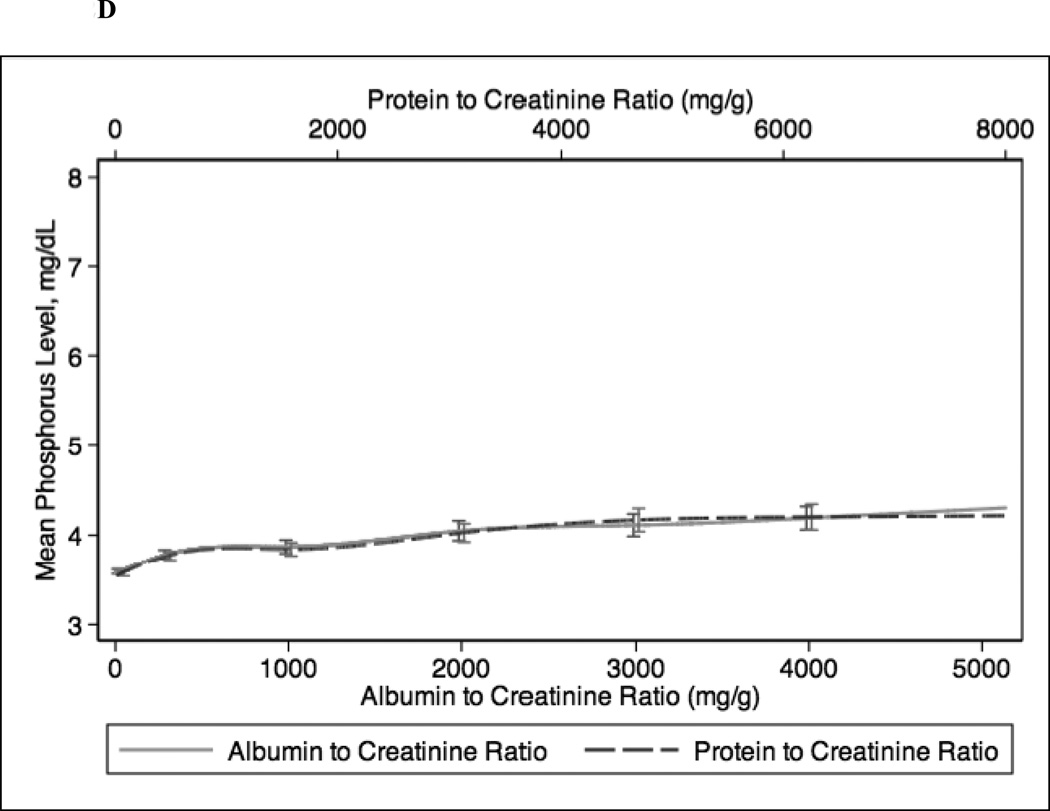
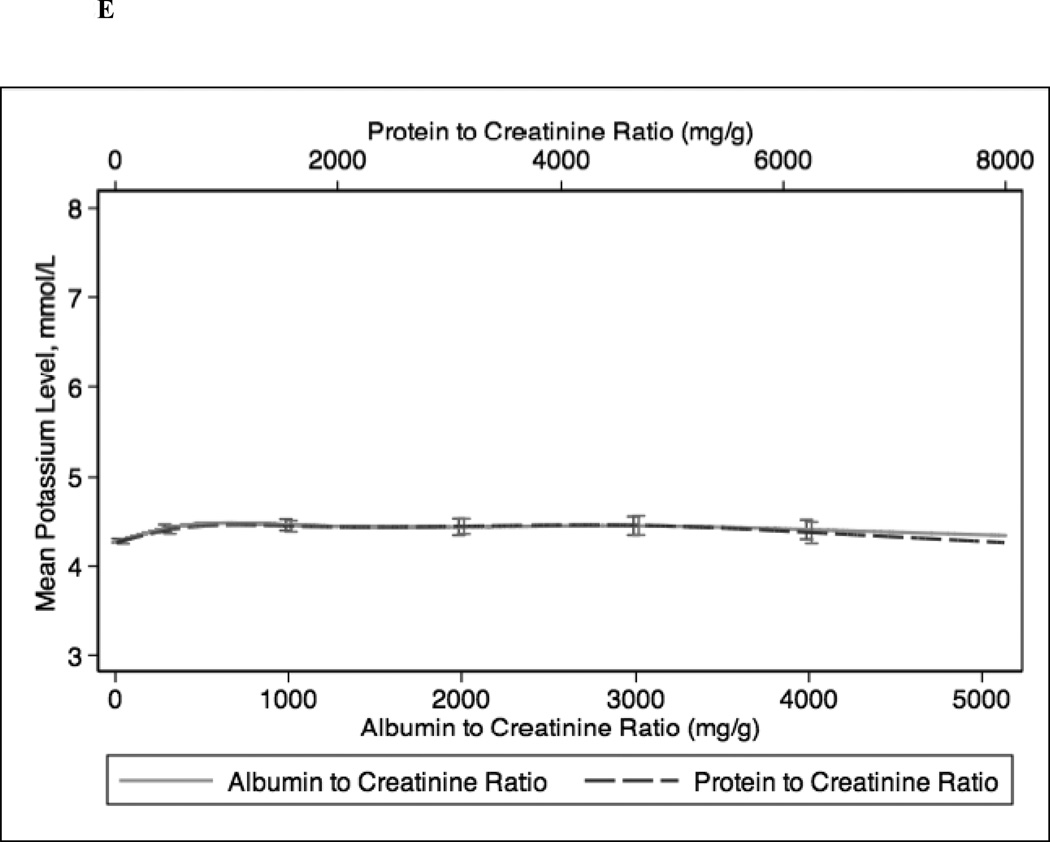
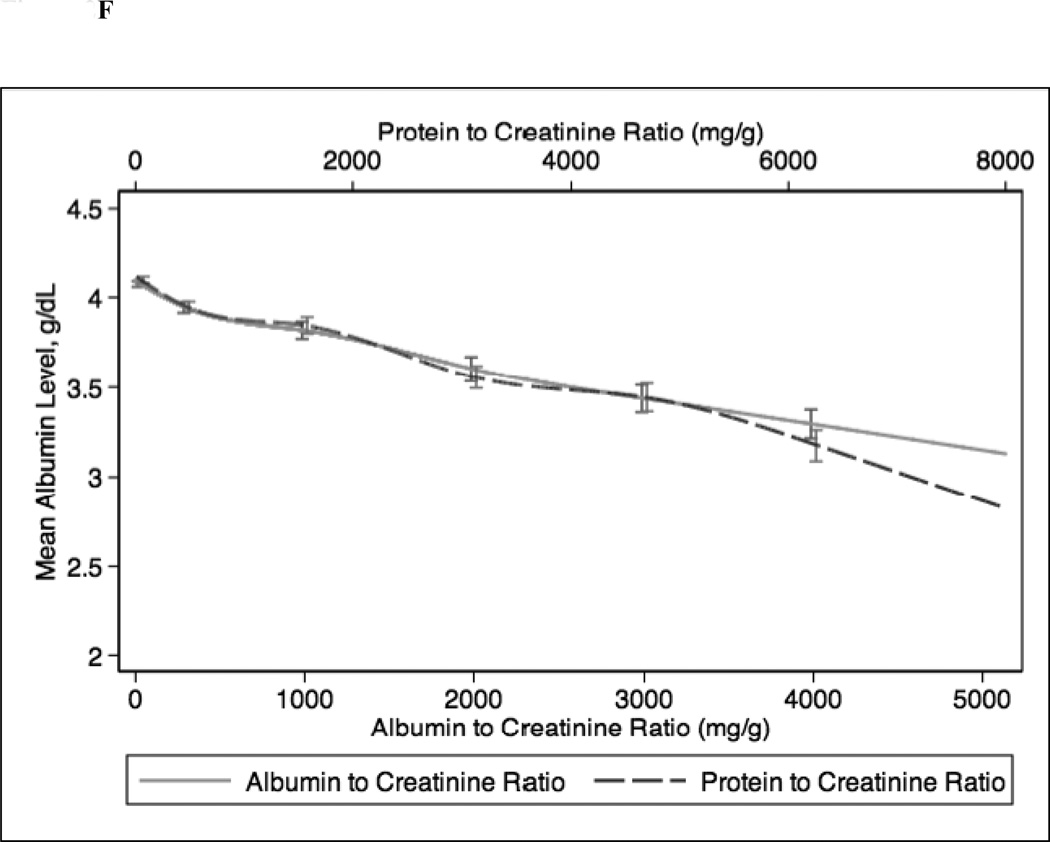
Mean eGFR was 43 ± 13 (SD) ml/min/1.73 m2 and median levels of PCR and ACR were 140 and 46 mg/g, respectively. In continuous analyses adjusted for eGFR, higher ACR and PCR were comparable and both were associated with lower levels of serum hemoglobin, bicarbonate, and albumin and higher levels of parathyroid hormone, phosphorus, and potassium. Across all outcomes, the associations of ACR and PCR were comparable with only small, absolute differences in the outcome measure. Similar associations were seen in patients with diabetes mellitus.
Limitations
Participants largely had moderate CKD with low levels of ACR and PCR, so results may not be generalizable to all CKD populations.
Conclusions
In persons with CKD, ACR and PCR are relatively comparable in their associations with common complications of CKD. Thus routine measurement of PCR may provide similar information as ACR in managing immediate complications of CKD.
Chronic kidney disease (CKD) is very prevalent among adults in the United States and associated with poor outcomes (1). As a result, there has been a lot of interest in measurement of total proteinuria and albuminuria, important markers of kidney damage that are used as prognostic indicators and therapeutic targets in patients with CKD. In contrast to more novel urinary markers investigated in research studies, testing for albuminuria and total proteinuria is widely available and thus a fundamental part of clinical practice. High total proteinuria and albuminuria are independently associated with adverse outcomes in patients with CKD, with and without diabetes (2–8). Albuminuria was recently incorporated into national staging and risk stratification criteria for CKD by KDIGO (9, 10). Interestingly, some national and international guidelines have not endorsed measurement of total proteinuria (10–12).
Despite the large body of literature demonstrating their predictive and prognostic potential, there have been limited studies of head-to-head comparisons of albuminuria versus total proteinuria and there are inconsistencies in which measure is used in research studies and in clinical practice. Some studies have found albuminuria to be superior (13), some have shown total proteinuria to be better (14), while still others have found both measures to be equivalent predictors of outcomes such as end-stage renal disease (ESRD) and mortality (15, 16). Additionally, while some studies among CKD and non-CKD populations have shown strong correlations between albuminuria and total proteinuria (14, 17–19), others have not (20).
Identification of concurrent metabolic complications of CKD is an important part of clinical management and has received attention recently as a marker of decreased kidney function (21, 22). A recent cross-sectional study of NHANES (National Health and Nutrition Examination Survey) participants found that albuminuria, like low eGFR, was also associated with anemia, acidosis, hypoalbuminemia and hyperparathyroidism (21).
In this study, we examined the associations between albumin-creatinine ratio (ACR) and concurrent common complications of CKD (lower levels of serum hemoglobin, bicarbonate, and albumin and higher levels of serum parathyroid hormone (PTH), phosphorus, and potassium) and compared them with the associations between protein-creatinine ratio (PCR) and the same complications within a large, diverse cohort of patients with CKD enrolled in the Chronic Renal Insufficiency Cohort (CRIC) study. We hypothesized that ACR would be more strongly associated with common complications of CKD.
METHODS
Study Population
This was a cross-sectional analysis of baseline data from the CRIC study, a multi-center observational study of 3,939 patients with mild to severe CKD (eGFR range, 20–70 ml/min/1.73 m2) recruited from seven centers across the United States (23, 24). The inclusion and exclusion criteria have been previously described (23). For this study, patients were excluded from analysis if they were missing values for either PCR or ACR (n=169) or any of our outcomes of interest (levels of hemoglobin, bicarbonate, parathyroid hormone [PTH], phosphorus, potassium or albumin) (n=172), or had outlying ACR exceeding the 97.5th percentile (n=117) (to correspond to reasonable physiological values and to limit the affect of outliers on the regression), leaving a final analytical sample of 3,481 patients.
Measures of Urine ACR and PCR
The two predictors were spot urine PCR and spot urine ACR. Because spot sample ratios have been shown to correlate well with 24-hour urine collection measurements, ACR and PCR are commonly measured in clinical practice for convenience (25–27). The PCR (mg/g) was calculated as spot urine total protein concentration divided by spot urine creatinine concentration, and the ACR (mg/g) was calculated as spot urine albumin concentration divided by spot urine creatinine concentration from 24-hour urine samples. Urine albumin concentration was determined with the immunoturbidometric method, and urine protein concentration was determined with the turbidometric method with benzethonium chloride. Urine creatinine concentration was determined using the kinetic rate Jaffe method. Intra-assay coefficients of variation (CVs) were 1.9%, 3.8%, and 2.1% for urine albumin, total urine protein and urine creatinine, respectively.
Complications of CKD
We evaluated the associations of PCR and ACR with measures of common complications associated with CKD that have been identified as clinical targets by the National Kidney Foundation–Kidney Disease Outcomes Quality Initiative (28): serum hemoglobin, bicarbonate, PTH, phosphorus, potassium and albumin. Hemoglobin was measured locally at each CRIC clinical center (29). Electrolytes were measured at the CRIC central laboratory at the University of Pennsylvania (29). Serum potassium, bicarbonate, albumin and phosphorus were measured with aVITROS 950 (Ortho Clinical Diagnostics). Total intact PTH was measured with the scantibodies immunoradiometric assay. Outcomes were analyzed as continuous variables.
Covariates
To characterize the study population, we examined age, sex, race (by self-report), diabetes status (based on glucose levels or self-reported use of insulin or anti-diabetic medication), serum creatinine, eGFR calculated by the 4-variable MDRD (Modification of Diet in Renal Disease) Study equation (based on original entry criteria for CRIC study) (30), systolic and diastolic blood pressure, history of any cardiovascular disease (by selfreport), BMI (determined by weight in kilograms divided by height in meters squared), and use of ACE inhibitors or ARB medications (by self-report).
Statistical Methods
Population characteristics are reported using means and medians as appropriate across categories of ACR based on clinical cut-offs (ACR <30, 30–299 and ≥300 mg/g) We compared characteristics of participants included versus excluded in the analysis. We calculated the Spearman correlation coefficient to assess the correlation between ACR and PCR among the study population as a whole and among participants with diabetes mellitus. We used linear regression models to estimate the predicted value of each CKD complication across the range of ACR and PCR. We compared values of ACR and PCR with a scatterplot, using both LOWESS and Deming methods to fit the regression. We explored the effect of important covariates such as demographics, blood pressure, diabetes mellitus and use of ACE inhibitors and ARB medications in multivariate models on the regression of ACR and PCR (modeled as the log of the ACR/PCR ratio).
Distributions of each outcome were explored and found to be normally distributed. PTH was log-transformed given the skewed distribution. We then used restricted cubic splines to model the association between ACR and PCR with each outcome, adjusting for eGFR, to allow for non-linearities detected in exploratory analysis. To avoid artifacts resulting from knot placement, knots were placed 30, 300, 1000, 2000, 3000, and 4000 mg/g for ACR, and at equivalent points in the range of PCR (0.047, 0.5, 1.6, 3.1, 4.7 and 6.2 mg/g). We modeled eGFR using a 5-knot cubic spline, because the linearity assumption was violated. Linearity was assessed by a joint test for the 2nd through 4th cubic spline basis functions, which capture the non-linearity. In clinical settings, the resulting predicted values would be interpreted in the light of other patient characteristics, but without formal adjustment for covariates. Accordingly, we did not adjust for demographic characteristics, co-morbid diseases, or pertinent but uncommonly (<10%) used medications (e.g. phosphorus binders, Kayexalate) that would affect our outcomes of interest.
In sensitivity analyses, we repeated our spline analyses stratified by self-reported diabetes mellitus status, because prior literature has suggested that ACR is superior in determining prognosis compared with PCR in this particular subgroup (27, 31).
All analyses were conducted using Stata version 12 (StataCorp LP, College Station, TX).
Regulatory Approval
De-identified data for this analysis were retrieved from the Data Repository of the National Institute of Diabetes and Digestive and Kidney Diseases (NIDDK) (https://www.niddkrepository.org) after appropriate institutional review board approval was obtained.
RESULTS
At baseline, mean age of our study participants was 58.6 ± 10.9 (standard deviation) years and participants were diverse in terms of gender, race (white/Caucasian and black/African American), and diabetes status (Table 1). On average, study participants had moderate CKD (mean eGFR, 43.1 ± 13.4 ml/min/1.73 m2) and had generally well-controlled proteinuria and albuminuria. Systolic and diastolic blood pressures were within target ranges, and a large proportion of the population was taking ACE inhibitors or ARBs (Table 1). Those with the highest levels of ACR were younger, and were more likely to be men, Black, have lower eGFRs, have higher blood pressure, and be on an ACE inhibitor or ARB (Table 1).
Table 1.
Characteristics of study population by ACR level
| Characteristic | Total | ACR level (mg/g) | p for trend | ||
|---|---|---|---|---|---|
| < 30 | 30 – 299 | ≥300 | |||
| No. of participants | 3481 | 1548 | 953 | 980 | -- |
| Age, (y) | 58.6 ± 10.9 | 60.2 ± 9.7 | 58.9 ± 10.9 | 55.5 ± 11.9 | <0.001 |
| Female sex | 45.3 | 52.3 | 40.8 | 38.6 | <0.001 |
| Race/Ethnicity | <0.001 | ||||
| White/Caucasian | 47.7 | 54.8 | 44.7 | 39.5 | -- |
| Black/African American | 41.8 | 37.5 | 44.6 | 45.9 | -- |
| Other | 10.5 | 7.7 | 10.7 | 14.6 | -- |
| Diabetes mellitus | 46.7 | 34.8 | 49.5 | 62.7 | <0.001 |
| Serum creatinine (mg/dL) | 1.8 ± 0.6 | 1.6 ± 0.5 | 1.9 ± 0.6 | 2.2 ± 0.7 | <0.001 |
| eGFR (ml/min/1.73m2) | 43.1 ± 13.4 | 47.7 ± 12.9 | 41.8 ± 12.9 | 37.2 ± 11.9 | <0.001 |
| PCR(mg/g) | 140 [60–650] | 50 [40–80] | 220 [130–330] | 1450 [810–2780] | <0.001 |
| ACR (mg/g) | 45.7 [8.1–372.2] | 6.9 [4.1–14.2] | 91.8 [50.4–164.3] | 929.6 [496.7–1754.9] | -- |
| Systolic BP (mm Hg) | 127.4 ± 21.5 | 120.7 ± 18.2 | 128.2 ± 20.7 | 137.2 ± 23.1 | <0.001 |
| Diastolic BP (mm Hg) | 71.0 ± 12.5 | 68.7 ± 11.5 | 70.7 ± 12.7 | 74.7 ± 13.1 | <0.001 |
| Hemoglobin (g/dL) | 12.6 ± 1.8 | 12.9 ± 1.6 | 12.7 ± 1.8 | 12.2 ± 1.8 | <0.001 |
| Bicarbonate (mmol/L) | 24.5 ± 3.2 | 25.1 ± 3.0 | 24.2 ± 3.2 | 23.8 ± 3.2 | <0.001 |
| Phosphorus (mg/dL) | 3.7 ± 0.6 | 3.6 ± 0.6 | 3.7 ± 0.7 | 3.9 ± 0.7 | <0.001 |
| Albumin (g/dL) | 4.0 ± 0.4 | 4.1 ± 0.4 | 4.0 ± 0.4 | 3.7 ± 0.4 | <0.001 |
| Potassium (mmol/L) | 4.3 ± 0.5 | 4.3 ± 0.5 | 4.4 ± 0.5 | 4.4 ± 0.6 | <0.001 |
| Parathyroid hormone (pg/mL) | 53.0 [34.5–86.7] | 43.0 [30.6–64.6] | 58.0 [37.6–89.0] | 74.5 [44.8–125.3] | <0.001 |
| Any cardiovascular disease | 33.1 | 28.0 | 37.3 | 37.1 | <0.001 |
| BMI (kg/m2) | 32.1 ± 7.8 | 32.1 ± 7.9 | 31.6 ± 7.4 | 32.7 ± 8.1 | 0.2 |
| ACE inhibitor/ARB use | 68.6 | 63.0 | 71.8 | 74.4 | <0.001 |
Note: Values for categorical variables are given as percentages; values for continuous variables are given as mean ± standard deviation or median [interquartile range]. Conversion factors for units: creatinine in mg/dL to μmol/L, ×88.4; phosphorus in mg/dL to mmol/L, ×0.3229.
ACR, albumin-creatinine ratio; PCR, protein-creatinine ratio; BP, blood pressure; BMI, body mass index; eGFR, estimated glomerular filtration rate; ACE, angiotensin-converting enzyme; ARB, angiotensin receptor blocker
Compared with the study population, the 458 participants who were excluded were younger, less likely to be white, and more likely to have diabetes, and they had slightly lower eGFRs, higher PCRs and ACRs, and higher blood pressure (Table S1, available as online supplementary material). The higher PCRs and ACRs among excluded participants is explained by the fact that we excluded participants with the upper 2.5% distribution of PCRs and ACRs, as the range of these values were very extreme (and not physiologic).
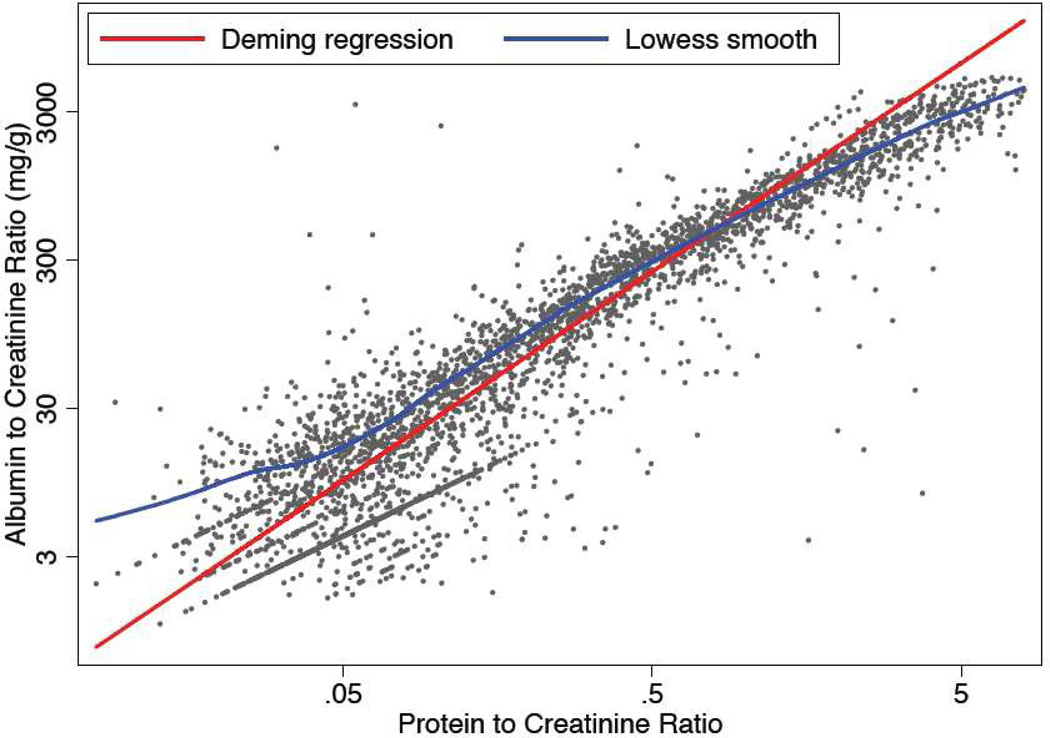
ACR and PCR were highly correlated (Spearman correlation coefficients were0.92 and 0.94 for entire study population and participants with diabetes mellitus, respectively; Figure 1). Younger age, male sex, non-white race, lower eGFR, diabetes mellitus and use of ACE inhibitors and ARBs were all significantly (p<0.05) associated with a higher ACR/PCR ratio (Table 2).
Figure 1.
Scatterplot of albumin-creatinine ratio (ACR) versus protein-creatinine ratio (PCR)
Table 2.
Multivariate association of clinical variables with ACR/PCR ratio
| Covariate | Relative change* (95% CI) | p-value |
|---|---|---|
| Age (per 10-y greater) | 0.87 (0.85, 0.90) | <0.001 |
| Female sex | 0.75 (0.71, 0.79) | <0.001 |
| Black race | 1.24 (1.16, 1.31) | <0.001 |
| Other race | 1.25 (1.15, 1.37) | <0.001 |
| eGFR (per 10-ml/min/1.73 m2 lower) | 1.22 (1.19, 1.24) | <0.001 |
| Diabetes | 1.33 (1.26,1.41) | <0.001 |
| ACE inhibitor use | 1.14 (1.08, 1.22) | <0.001 |
| ARB use | 1.25 (1.16, 1.34) | <0.001 |
Note: Regression equation: Log ACR/PCR=7.08+ (age/10*−0.135) +(eGFR/10*0.195 ) + (−0.290 if female) +(0.211 if Black) + (0.227 if other race) + (0.288 if diabetic) + (0.135 if taking ACE inhibitor) + (0.221 if taking ARB).
ACR, albumin-creatinine ratio; PCR, protein-creatinine ratio; eGFR, estimated glomerular filtration rate; ACE, angiotensin-converting enzyme; ARB, angiotensin receptor blocker; CI, confidence interval.
Relative change in ACR/PCR ratio.
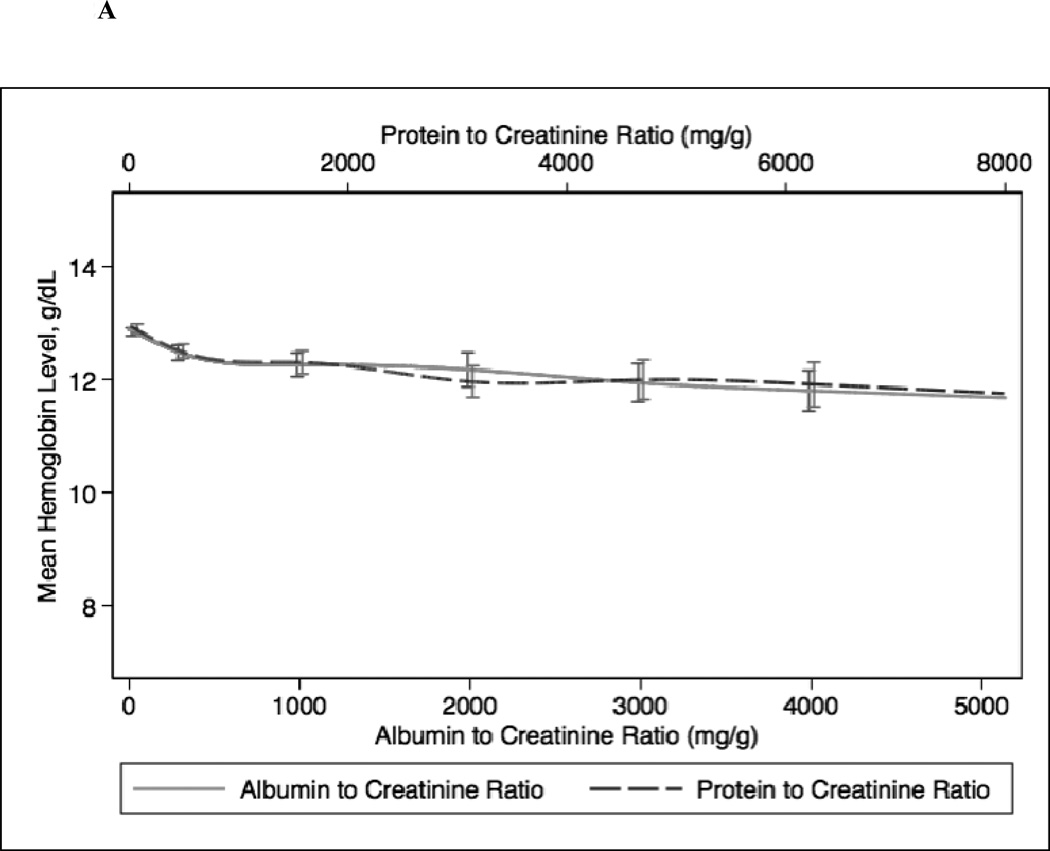
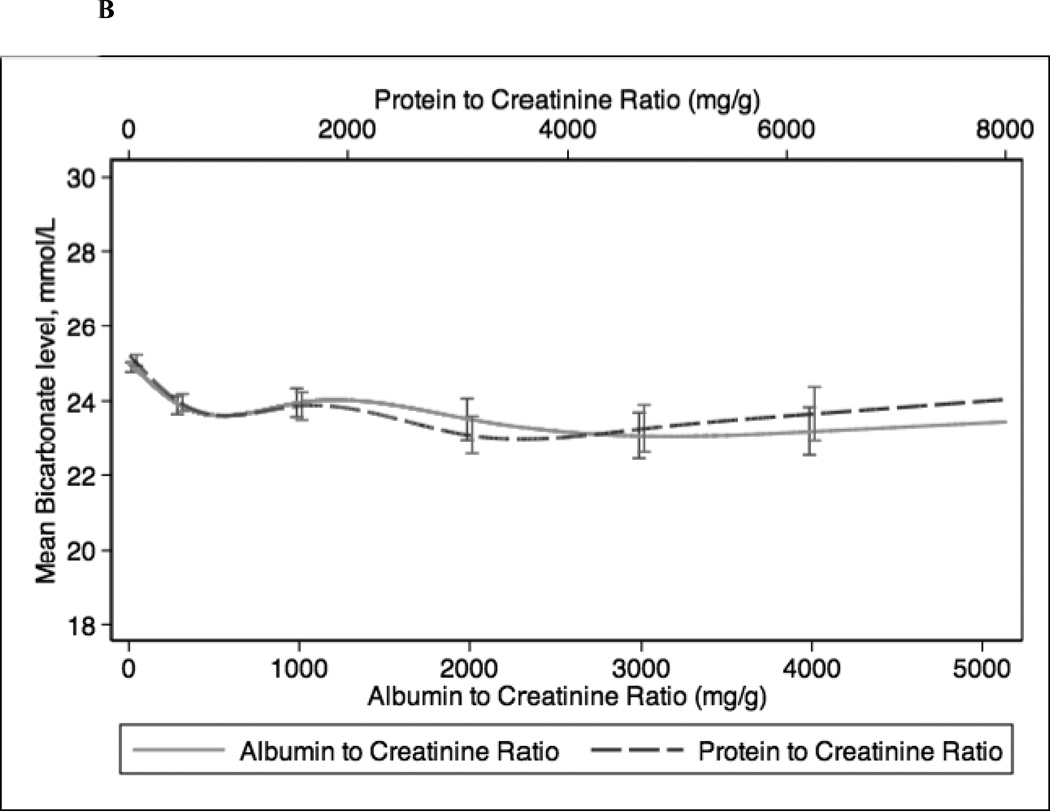
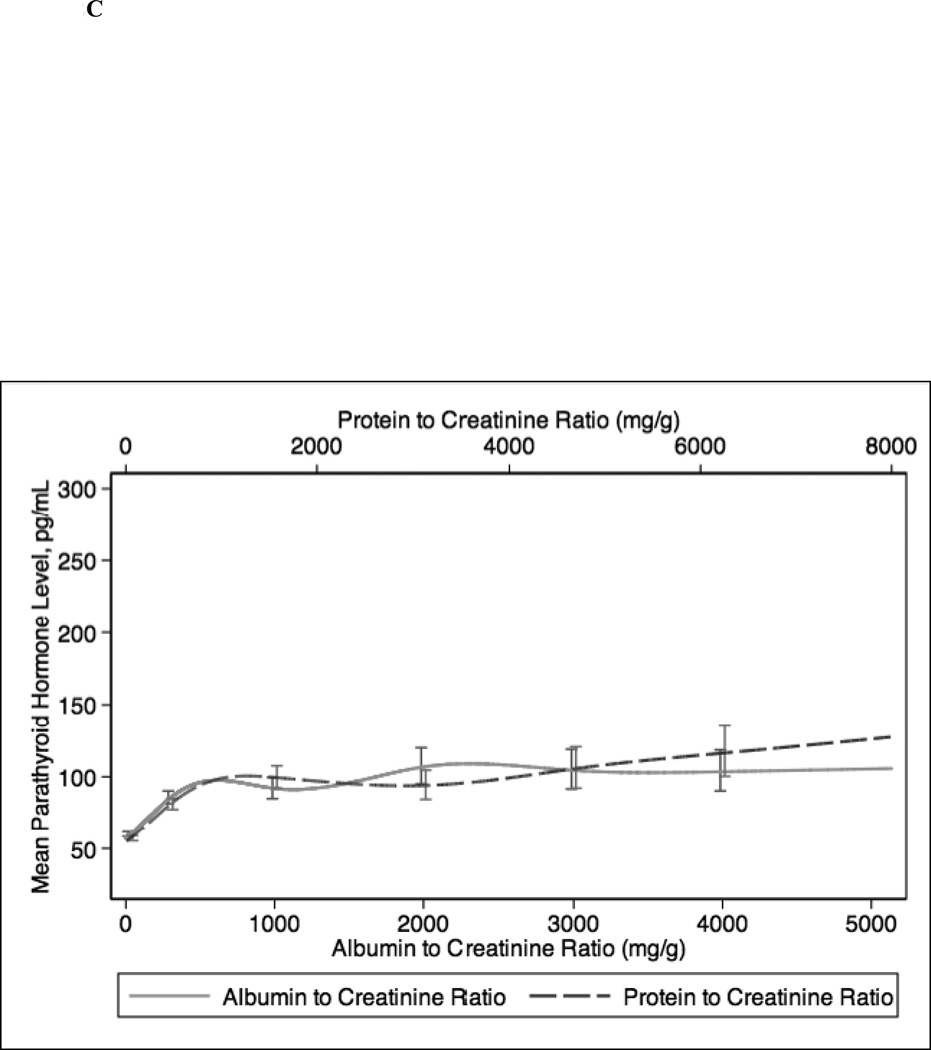
In continuous analyses adjusted for eGFR, higher ACR and PCR were comparable and both were associated with lower levels of serum hemoglobin, bicarbonate, and albumin and higher levels of PTH, phosphorus, and potassium (Figure 2). The greatest differences between ACR and PCR were at higher ranges of each (e.g. ACR >3000 mg/g and PCR >4 mg/g), where for example higher PCR was more strongly associated with higher PTH concentration compared with ACR (Figure 1c).
Figure 2.
Spline curves for the adjusted (for eGFR) association between albumin-creatinine ratio (ACR) and protein-creatinine ratio (PCR) and (a) serum hemoglobin; (b) serum bicarbonate; (c) serum parathyroid hormone (PTH); (d) serum phosphorus; (e) serum potassium and (f) serum albumin.
In sensitivity analyses, we stratified our study population by diabetes mellitus status (Figure S1). Among patients with diabetes mellitus, associations of ACR and PCR with hemoglobin, bicarbonate, phosphorus, potassium and albumin were similar. Similar to the main analysis, PCR was more strongly associated with higher PTH at very high levels of urinary protein excretion (ACR >3000 mg/g or PCR >5 mg/g). Among patients without diabetes mellitus, increasing levels of ACR and PCR were similarly associated with lower levels of bicarbonate and higher levels of PTH, phosphorus, and potassium. However, at very high levels of protein excretion, higher PCR was more strongly associated with lower levels of hemoglobin and albumin.
DISCUSSION
Measurement of albuminuria and total proteinuria are a central aspect of the management and prognosis of patients with CKD. However, there is uncertainty regarding the best measure of urinary protein excretion—this has clinically important implications from a practical and cost-effectiveness perspective. In this study of CRIC study participants with primarily moderate CKD, we found that the strengths of the associations between higher ACR and higher PCR with common complications of CKD (lower levels of serum hemoglobin, serum bicarbonate, and serum albumin and higher levels of serum PTH, serum phosphorus, and serum potassium) were comparable. When we stratified our analyses by diabetes mellitus status, we found that among diabetics, the associations with ACR and PCR were similar to those in the overall study population.
Our findings make sense physiologically. Albumin is a low molecular weight protein, and albuminuria is likely a reflection of early damage to the glomerular vascular endothelium as well as decreased ability of the tubule to reabsorb urinary albumin. Urinary measurement of total proteinuria includes higher molecular weight non-albumin urinary proteins as well, which may be tubular as well as glomerular in origin. However albumin still comprises the majority of total urinary protein in patients with CKD (particularly at higher ranges of proteinuria) (32), thus it makes sense that these two clinical measures would be comparable in the general CKD population. The few studies that have compared ACR and PCR have yielded conflicting results. Some prior studies have suggested that measurement of albuminuria may more specific, more sensitive and better standardized than measurement of total proteinuria (27, 31, 33, 34). A recent study reported that ACR and PCR did not correlate well at lower ranges of proteinuria (35). In contrast, another study reported that PCR was more sensitive (compared with ACR) as a screening test when proteinuria was <0.5 g/d and <1.0 g/d.(20) Consistent with our findings, many studies among CKD and non-CKD populations have shown strong correlations between ACR and PCR (14, 17–19). Yet, the recently published KDIGO guidelines strongly advocate for measurement of ACR (over PCR), partly due to limitations in measurement of PCR including substantial sample-to-sample variations in the quantity and composition of proteins and between-laboratory variations (10). It is interesting that, even despite these limitations, PCR was comparable to ACR in the associations with common complications of CKD. Thus there remains discord among national and international guidelines, with some advocating for ACR to replace measurement of PCR (10–12) and others recommending retaining PCR (36). Our study supports the argument that measurement of PCR should not be completely abandoned in clinical practice.
To our knowledge, only one prior investigation has evaluated ACR and associations with complications of CKD.21 Among persons without CKD in NHANES (mean eGFR, 96 ml/min/1.73 m2), ACR was found to be associated with hypoalbuminemia and hyperparathyroidism but only weakly associated with anemia or acidosis (21). ACR was not associated with hyperphosphatemia in that study; ACR was only compared with eGFR measures, and PCR was not studied.21 Our study extends the results of this previous analysis by focusing on comparisons between two central measures of urinary protein excretion that are widely used in clinical practice. Additionally, we studied only persons with CKD, a high-risk population in which detection of urinary protein and management of CKD complications are fundamental parts of routine care. Our results strengthen findings from previous studies to support measurement of PCR. This may be important in a climate where efforts are being made to reduce health care expenditures since measurement of ACR is 2–3 times more expensive than that of PCR. Furthermore, there is increasing interest in the study of non-albumin urinary proteins, which may also have prognostic value (37) and measurement of ACR alone may “miss” other non-albumin proteinuria (14). Thus, measure of PCR may provide important information in addition to ACR and is an important aspect of the management of patients with CKD.
A limited number of studies have examined associations of ACR versus PCR with longitudinal outcomes. A meta-analysis conducted by the Chronic Kidney Disease Consortium similarly concluded that there were no significant differences in the associations of PCR or ACR with mortality or ESRD (16). A study of 5,000 Scottish patients with CKD found that ACR and PCR were comparable in predicting ESRD or mortality (15). In contrast, another study of 700 diabetic patients found that ACR was superior in predicting doubling of creatinine or ESRD compared with albuminuria or proteinuria from 24-hour urine collections (13). However this study did not directly compare ACR versus PCR; and the comparison of spot urine collections versus 24-hour urine collections may be influenced by the strong association of spot urine creatinine concentration with poor outcomes (38, 39). Predicting risk of longitudinal outcomes is clearly important in the care of CKD patients. However our study may help guide more immediate management of these patients, because metabolic complications of CKD are important for both short-term and long-term outcomes.
When we stratified our analysis by participants with versus without diabetes mellitus, we found that, similar to in our main analyses, ACR and PCR were similarly associated with CKD complications among participants with diabetes. These data provide impetus that measurement of PCR may be reasonable even in patients with diabetes, which contradicts the current dogma that ACR is a superior measure particularly in this specific subgroup (27, 31).
Our analysis has several strengths. Our study population was relatively large and included a high proportion of Black and diabetic patients, which is very representative of the U.S. CKD population. All patients had simultaneous measures of ACR and PCR performed in a single laboratory. We had detailed information on concurrent CKD complications.
Our study has a few limitations as well. Overall, study participants had moderate CKD with low levels of ACR and PCR. We cannot extrapolate our findings to patients with preserved eGFR. Similarly, the high proportion of participants who were taking ACE inhibitors/ARBs suggests that in general participants were receiving appropriate pharmaceutical treatment, thus our results may not be generalizable to all CKD populations. This was a cross-sectional observational study so we were not able to examine longitudinal outcomes or determine causality. We were not able to determine if these associations differed by cause of CKD (other than co-existing diabetes), because the majority of the study population did not know the cause of disease. Finally, we were not able to delineate the precise mechanisms to explain the observed associations.
In conclusion, we found that in persons with CKD, ACR and PCR were comparable measures in their associations with common clinical complications of CKD. Thus, clinicians and health systems should not abandon routine measurement of PCR in patients with CKD, as PCR may help guide immediate management of CKD complications and also incorporate measure of non-albumin urinary proteins that may be important for prognosis as well.
Supplementary Material
ACKNOWLEDGEMENTS
The CRIC study was supported by the NIDDK. The data from the CRIC study reported here were supplied by the NIDDK Central Repositories. This manuscript does not necessarily reflect the opinions or views of the CRIC study, the NIDDK Central Repositories, or the NIDDK.
Support: This study was supported by the National Institutes of Health (grants K23DK88865 [Dr Bansal], K24 DK92291 [Dr Hsu], and U01 DK60902 [Dr Hsu]) and the University of California, San Francisco, Resource Allocation Program for Trainees Pathways Explore Summer Fellowship (Ms Fisher).
Footnotes
Publisher's Disclaimer: This is a PDF file of an unedited manuscript that has been accepted for publication. As a service to our customers we are providing this early version of the manuscript. The manuscript will undergo copyediting, typesetting, and review of the resulting proof before it is published in its final citable form. Please note that during the production process errors may be discovered which could affect the content, and all legal disclaimers that apply to the journal pertain.
Financial Disclosure: The authors declare that they have no other relevant financial interests.
Supplementary Material
Table S1: Characteristics of participants versus those excluded from study.
Figure S1: Adjusted associations between ACR and PCR and measures of CKD complications in diabetic/nondiabetic participants.
Note: The supplementary material accompanying this article (doi:_______) is available at www.ajkd.org
REFERENCES
- 1.Coresh J, Selvin E, Stevens LA, et al. Prevalence of chronic kidney disease in the United States. JAMA. 2007;298:2038–2047. doi: 10.1001/jama.298.17.2038. [DOI] [PubMed] [Google Scholar]
- 2.Lea J, Greene T, Hebert L, et al. The relationship between magnitude of proteinuria reduction and risk of end-stage renal disease: results of the African American study of kidney disease and hypertension. Arch Intern Med. 2005;165:947–953. doi: 10.1001/archinte.165.8.947. [DOI] [PubMed] [Google Scholar]
- 3.Ruggenenti P, Perna A. Remuzzi G and Gruppo Italiano di Studi Epidemiologici in N: ACE inhibitors to prevent end-stage renal disease: when to start and why possibly never to stop: a post hoc analysis of the REIN trial results. Ramipril Efficacy in Nephropathy. J Am Soc Nephrol. 2001;12:2832–2837. doi: 10.1681/ASN.V12122832. [DOI] [PubMed] [Google Scholar]
- 4.de Zeeuw D, Remuzzi G, Parving HH, et al. Albuminuria, a therapeutic target for cardiovascular protection in type 2 diabetic patients with nephropathy. Circulation. 2004;110:921–927. doi: 10.1161/01.CIR.0000139860.33974.28. [DOI] [PubMed] [Google Scholar]
- 5.Brenner BM, Cooper ME, de Zeeuw D, et al. Effects of losartan on renal and cardiovascular outcomes in patients with type 2 diabetes and nephropathy. N Engl J Med. 2001;345:861–869. doi: 10.1056/NEJMoa011161. [DOI] [PubMed] [Google Scholar]
- 6.Bello AK, Hemmelgarn B, Lloyd A, et al. Associations among estimated glomerular filtration rate, proteinuria, and adverse cardiovascular outcomes. Clin J Am Soc Nephrol. 2011;6:1418–1426. doi: 10.2215/CJN.09741110. [DOI] [PMC free article] [PubMed] [Google Scholar]
- 7.Hemmelgarn BR, Manns BJ, Lloyd A, et al. Relation between kidney function, proteinuria, and adverse outcomes. JAMA. 2010;303:423–429. doi: 10.1001/jama.2010.39. [DOI] [PubMed] [Google Scholar]
- 8.Gansevoort RT, Matsushita K, van der Velde M, et al. Lower estimated GFR and higher albuminuria are associated with adverse kidney outcomes. A collaborative meta-analysis of general and high-risk population cohorts. Kidney Int. 2011;80:93–104. doi: 10.1038/ki.2010.531. [DOI] [PMC free article] [PubMed] [Google Scholar]
- 9.Levey AS, de Jong PE, Coresh J, et al. The definition, classification, and prognosis of chronic kidney disease: a KDIGO Controversies Conference report. Kidney Int. 2011;80:17–28. doi: 10.1038/ki.2010.483. [DOI] [PubMed] [Google Scholar]
- 10.KDIGO 2012 Clinical Practice Guideline for the Evaluation and Management of Chronic Kidney Disease. doi: 10.1038/ki.2013.243. http://kdigo.org/home/guidelines/ckd-evaluation-management. Accessed. [DOI] [PubMed]
- 11.Montanes Bermudez R, Gracia Garcia S, Perez Surribas D, et al. Consensus document. Recommendations on assessing proteinuria during the diagnosis and follow-up of chronic kidney disease. Nefrologia : publicacion oficial de la Sociedad Espanola Nefrologia. 2011;31:331–345. doi: 10.3265/Nefrologia.pre2011.Jan.10807. [DOI] [PubMed] [Google Scholar]
- 12.Johnson DW, Jones GR, Mathew TH, et al. Chronic kidney disease and measurement of albuminuria or proteinuria: a position statement. The Medical journal of Australia. 2012;197:224–225. doi: 10.5694/mja11.11468. [DOI] [PubMed] [Google Scholar]
- 13.Lambers Heerspink HJ, Gansevoort RT, Brenner BM, et al. Comparison of different measures of urinary protein excretion for prediction of renal events. J Am Soc Nephrol. 2010;21:1355–1360. doi: 10.1681/ASN.2010010063. [DOI] [PMC free article] [PubMed] [Google Scholar]
- 14.Atkins RC, Briganti EM, Zimmet PZ, Chadban SJ. Association between albuminuria and proteinuria in the general population: the AusDiab Study. Nephrol Dial Transplant. 2003;18:2170–2174. doi: 10.1093/ndt/gfg314. [DOI] [PubMed] [Google Scholar]
- 15.Methven S, MacGregor MS, Traynor JP, Hair M, O'Reilly DS, Deighan CJ. Comparison of urinary albumin and urinary total protein as predictors of patient outcomes in CKD. Am J Kidney Dis. 2011;57:21–28. doi: 10.1053/j.ajkd.2010.08.009. [DOI] [PubMed] [Google Scholar]
- 16.Astor BC, Matsushita K, Gansevoort RT, et al. Lower estimated glomerular filtration rate and higher albuminuria are associated with mortality and end-stage renal disease. A collaborative meta-analysis of kidney disease population cohorts. Kidney Int. 2011;79:1331–1340. doi: 10.1038/ki.2010.550. [DOI] [PMC free article] [PubMed] [Google Scholar]
- 17.Wu MT, Lam KK, Lee WC, et al. Albuminuria, proteinuria, and urinary albumin to protein ratio in chronic kidney disease. Journal of clinical laboratory analysis. 2012;26:82–92. doi: 10.1002/jcla.21487. [DOI] [PMC free article] [PubMed] [Google Scholar]
- 18.Guy M, Borzomato JK, Newall RG, Kalra PA, Price CP. Protein and albumin-to-creatinine ratios in random urines accurately predict 24 h protein and albumin loss in patients with kidney disease. Annals of clinical biochemistry. 2009;46:468–476. doi: 10.1258/acb.2009.009001. [DOI] [PubMed] [Google Scholar]
- 19.Newman DJ, Thakkar H, Medcalf EA, Gray MR, Price CP. Use of urine albumin measurement as a replacement for total protein. Clin Nephrol. 1995;43:104–109. [PubMed] [Google Scholar]
- 20.Methven S, MacGregor MS, Traynor JP, O'Reilly DS, Deighan CJ. Assessing proteinuria in chronic kidney disease: protein-creatinine ratio versus albumin-creatinine ratio. Nephrol Dial Transplant. 2010;25:2991–2996. doi: 10.1093/ndt/gfq140. [DOI] [PubMed] [Google Scholar]
- 21.Inker LA, Coresh J, Levey AS, Tonelli M, Muntner P. Estimated GFR, albuminuria, and complications of chronic kidney disease. J Am Soc Nephrol. 2011;22:2322–2331. doi: 10.1681/ASN.2010111181. [DOI] [PMC free article] [PubMed] [Google Scholar]
- 22.Hsu CY, Propert K, Xie D, et al. Measured GFR does not outperform estimated GFR in predicting CKD-related complications. J Am Soc Nephrol. 2011;22:1931–1937. doi: 10.1681/ASN.2010101077. [DOI] [PMC free article] [PubMed] [Google Scholar]
- 23.Feldman HI, Appel LJ, Chertow GM, et al. The Chronic Renal Insufficiency Cohort (CRIC) Study: Design and Methods. J Am Soc Nephrol. 2003;14:S148–S153. doi: 10.1097/01.asn.0000070149.78399.ce. [DOI] [PubMed] [Google Scholar]
- 24.Lash JP, Go AS, Appel LJ, et al. Chronic Renal Insufficiency Cohort (CRIC) Study: Baseline Characteristics and Associations with Kidney Function. Clin J Am Soc Nephrol. 2009;4:1302–1311. doi: 10.2215/CJN.00070109. [DOI] [PMC free article] [PubMed] [Google Scholar]
- 25.Gaspari F, Perico N, Remuzzi G. Timed urine collections are not needed to measure urine protein excretion in clinical practice. Am J Kidney Dis. 2006;47:1–7. doi: 10.1053/j.ajkd.2005.10.014. [DOI] [PubMed] [Google Scholar]
- 26.Miller WG, Bruns DE, Hortin GL, et al. Current issues in measurement and reporting of urinary albumin excretion. Clin Chem. 2009;55:24–38. doi: 10.1373/clinchem.2008.106567. [DOI] [PubMed] [Google Scholar]
- 27.McIntyre NJ, Taal MW. How to measure proteinuria? Curr Opin Nephrol Hypertens. 2008;17:600–603. doi: 10.1097/MNH.0b013e328313675c. [DOI] [PubMed] [Google Scholar]
- 28.National Kidney Foundation. K/DOQI Clinical Practice Guidelines for Chronic Kidney Disease: Evaluation, Classification, and Stratification. http://www.kidney.org/professionals/kdoqi/guidelines_ckd. Accessed.
- 29.Hsu CY, Propert K, Xie D, et al. Measured GFR Does Not Outperform Estimated GFR in Predicting CKD-related Complications. J Am Soc Nephrol. 2011;22:1931–1937. doi: 10.1681/ASN.2010101077. [DOI] [PMC free article] [PubMed] [Google Scholar]
- 30.Levey AS, Bosch JP, Lewis JB, Greene T, Rogers N, Roth D, et al. A more accurate method to estimate glomerular filtration rate from serum creatinine: a new prediction equation. Modification of Diet in Renal Disease Study Group. Ann Intern Med. 1999;130:461–470. doi: 10.7326/0003-4819-130-6-199903160-00002. [DOI] [PubMed] [Google Scholar]
- 31.Guh JY. Proteinuria versus albuminuria in chronic kidney disease. Nephrology (Carlton, Vic) 2010;15(Suppl 2):53–56. doi: 10.1111/j.1440-1797.2010.01314.x. [DOI] [PubMed] [Google Scholar]
- 32.Birmingham DJ, Rovin BH, Shidham G, Bissell M, Nagaraja HN, Hebert LA, et al. Relationship between albuminuria and total proteinuria in systemic lupus erythematosus nephritis: diagnostic and therapeutic implications. Clin J Am Soc Nephrol. 2008;3:1028–1033. doi: 10.2215/CJN.04761107. [DOI] [PMC free article] [PubMed] [Google Scholar]
- 33.Lamb EJ, MacKenzie F, Stevens PE. How should proteinuria be detected and measured? Annals of clinical biochemistry. 2009;46:205–217. doi: 10.1258/acb.2009.009007. [DOI] [PubMed] [Google Scholar]
- 34.Ballantyne FC, Gibbons J, O'Reilly DS. Urine albumin should replace total protein for the assessment of glomerular proteinuria. Annals of clinical biochemistry. 1993;30(Pt 1):101–103. doi: 10.1177/000456329303000119. [DOI] [PubMed] [Google Scholar]
- 35.Kim SM, Lee CH, Lee JP, et al. The association between albumin to creatinine ratio and total protein to creatinine ratio in patients with chronic kidney disease. Clin Nephrol. 2012 doi: 10.5414/CN107507. [DOI] [PubMed] [Google Scholar]
- 36.Scottish Intercollegiate Guidelines Network. Diagnosis and management of chronic kidney disease: A national clinical guideline. http://www.sign.ac.uk/pdf/sign103.pdf. Accessed.
- 37.Schrader J, Luders S, Kulschewski A, et al. Microalbuminuria and tubular proteinuria as risk predictors of cardiovascular morbidity and mortality in essential hypertension: final results of a prospective long-term study (MARPLE Study)*. J Hypertens. 2006;24:541–548. doi: 10.1097/01.hjh.0000209991.48928.c4. [DOI] [PubMed] [Google Scholar]
- 38.Ix JH, de Boer IH, Wassel CL, Criqui MH, Shlipak MG, Whooley MA. Urinary creatinine excretion rate and mortality in persons with coronary artery disease: the Heart and Soul Study. Circulation. 2010;121:1295–1303. doi: 10.1161/CIRCULATIONAHA.109.924266. [DOI] [PMC free article] [PubMed] [Google Scholar]
- 39.Carter CE, Gansevoort RT, Scheven L, et al. Influence of urine creatinine on the relationship between the albumin-to-creatinine ratio and cardiovascular events. Clin J Am Soc Nephrol. 2012;7:595–603. doi: 10.2215/CJN.09300911. [DOI] [PMC free article] [PubMed] [Google Scholar]
Associated Data
This section collects any data citations, data availability statements, or supplementary materials included in this article.


