
Fig. 1.
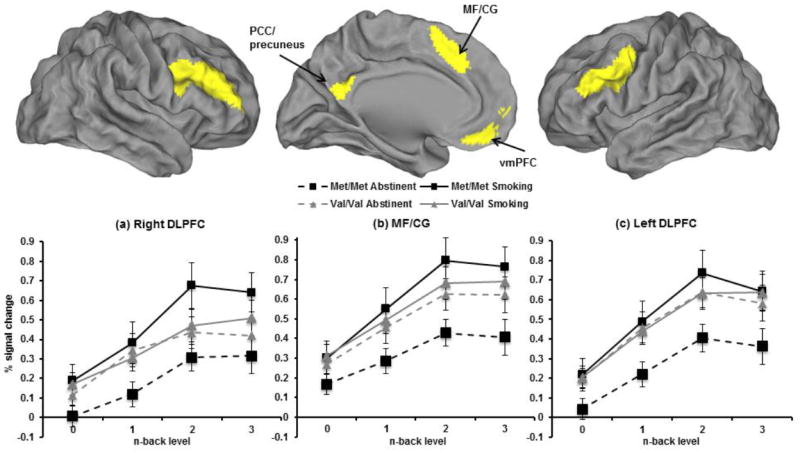
Colored regions represent functionally defined ROIs identified from the main effect of working memory load in a Fractal N-back task. Brain rendering performed with CARET (http://www.nitrc.org/projects/caret/). Line graphs represent BOLD % signal change during the N-back task by genotype, session, and back level. Genotype × session interaction in task-positive regions: (a) Right DLPFC (p=4.1×10⁻⁵), (b) bilateral MF/CG (p=4.7×10⁻⁵), and (c) left DLPFC (p=5.8×10⁻⁵) (Met/Met n=19; Val/Val n=17).