Abstract
Primitive erythropoiesis is a vital process for mammalian embryonic development. Here we report the generation and characterization of a new transgenic mouse line that expresses a histone H2B-CFP fusion protein in the nuclei of primitive erythroid cells. We demonstrate the potential of this ε-globin-histone H2B-CFP line for multicolor imaging and flow cytometry analysis. The ε-globin-H2B-CFP line was used to analyze the cell cycle distribution and proliferation of CFP-expressing primitive erythroblasts from E8.5–E13.5. We also evaluated phagocytosis of extruded CFP-positive nuclei by macrophages in fetal liver and placenta. The ε-globin-H2B-CFP transgenic mouse line adds to the available tools for studying the development of the primitive erythroid lineage.
Keywords: primitive erythropoiesis, transgenic mice, cyan fluorescent protein, histone fusion, fluorescent reporter, imaging
INTRODUCTION
Primitive erythroid cells (EryP) are the initial hematopoietic cell lineage formed during mammalian embryogenesis. EryP arise from mesodermal progenitors found in the yolk sac shortly after the end of gastrulation (reviewed by Baron et al., 2012). From ~170 progenitors at embryonic day (E)7.5, EryP expand ~30,000-fold to more than 5×10⁶ cells in the circulation at E12.5 (Fraser et al., 2007; Isern et al., 2011). For several days before the appearance of definitive (adult type) erythrocytes (EryD) in the circulation, EryP transport oxygen throughout the developing embryo and contribute to shear forces required for vascular remodeling (Lucitti et al., 2007). EryP mature as they circulate in the blood condensing and eventually expelling their nuclei (Fraser et al., 2007; Kingsley et al., 2004). These macrocytic cells accumulate hemoglobin to concentrations as high as 100 pg/cell, compared with ~22 pg/cell in an adult erythrocyte (Fantoni et al., 1968; Steiner and Vogel, 1973) and undergo a shift in expression of the major type of β-globin from βH1 to εY (Kingsley et al., 2006). Around E13.5, as the fetal liver becomes the major site of definitive hematopoiesis, EryD enter the bloodstream and rapidly outnumber EryP. EryP persist in the circulation through birth and possibly as long as several weeks thereafter but eventually disappear from the blood (Fraser et al., 2007).
A number of characteristics distinguish mammalian EryP from EryD. EryP progenitors form in the yolk sac from posterior mesoderm, while EryD are derived from hematopoietic stem cells that form from lateral plate mesoderm in a variety of sites in the embryo proper, umbilical and vitelline arteries, and placenta and seed the fetal liver, where they expand and differentiate (for reviews, see Baron et al., 2012; Dzierzak and Speck, 2008). In contrast with EryD, EryP circulate for a considerable portion of their life as nucleated cells (Baron et al., 2012; Palis et al., 2010). EryP are also significantly larger than EryD and express a distinct set of globin genes (reviewed by Baron et al., 2012). To identify and isolate EryP, we generated transgenic mouse models in which these cells are labeled by expression of a reporter (β-galactosidase (Belaoussoff et al., 1998), pancellular GFP (Dyer et al., 2001), or nuclear histone H2B-GFP (Isern et al., 2008)) under the control of human epsilon-globin regulatory elements. These transgenic mice allowed us to monitor the appearance, expansion and maturation of EryP lineage.
One of the final stages in EryP maturation involves the expulsion of the highly condensed nucleus for engulfment and destruction by fetal liver macrophages (Fraser et al., 2007; Isern et al., 2008; Kingsley et al., 2004). The ε-globin-H2B-GFP mouse line allowed us to observe this process directly (Isern et al., 2008). For analysis of EryP in combination with other cell types in the embryo, however, this line has limitations: most other available fluorescent transgenic mice carry a GFP reporter. To permit multicolor imaging of EryP in combination with cell types tagged with GFP or YFP, we generated a new line in which a histone H2B-cyan fluorescent protein (H2B-CFP) is expressed under the same regulatory elements as the earlier ε-globin-driven transgenes. The spectral properties of CFP expand the possibilities for multicolor imaging, as demonstrated in double transgenics created by mating with Afp-GFP (Kwon et al., 2006) and Flk1-H2B-YFP (Fraser et al., 2005) mice to label visceral endoderm or the embryonic vasculature, respectively.
Analysis of the cell cycle distribution and proliferation of CFP-expressing primitive erythroblasts from E8.5–E13.5 ε-globin-H2B-CFP transgenic embryos revealed that active proliferation continued through E11.5, decreased sharply by E12.5, and arrested by E13.5.
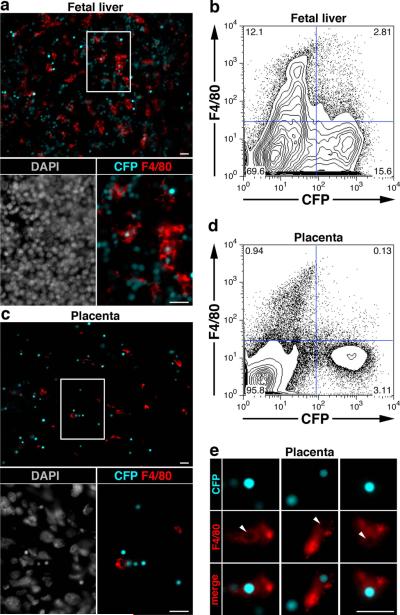
Millions of EryP enucleate within the 48-hour window from E12.5 to E14.5 (Fraser et al., 2007; Kingsley et al., 2004). A recent study of human placenta suggested that EryP nuclei might also be cleared from the circulation by placental macrophages (Van Handel et al., 2010). To explore this process further, we stained fetal liver and placental tissue for the macrophage marker F4/80. While macrophages in the fetal liver appear to be responsible for phagocytosis of the majority of EryP nuclei (Isern et al., 2008), smaller numbers of macrophages are also present in the placenta and can engulf EryP nuclei.
RESULTS AND DISCUSSION
Generation of ε-globin-H2B-CFP transgenic mice
The ε-globin-H2B-CFP vector was constructed using a minimal human ε-globin promoter (Trepicchio et al., 1993) and a truncated human μ Locus Control Region (Forrester et al., 1989) flanking the fragment coding for the fusion protein histone H2B-CFP. The same regulatory elements were used previously to generate ε-globin-LacZ (Belaoussoff et al., 1998), ε-globin-KGFP (Dyer et al., 2001) and ε-globin-H2B-GFP (Isern et al., 2008) transgenes. Expression of the resulting ε-globin-H2B-CFP construct was tested in mouse embryonic stem (ES) cells as described (Fraser et al., 2005). After removal of the bacterial backbone, the transgene was delivered into zygotes by pronuclear injection. Three founder (F0) mouse transgenic lines were identified by genotying using the polymerase chain reaction.
CFP expression marks primitive erythroblasts during mouse embryonic development
Transgene expression in the F0 mice was examined using flow cytometry and immunofluorescence microscopy. Two ε-globin-H2B-CFP lines showed expression patterns similar to the ε-globin-KGFP and -H2B-GFP mice previously described (Fraser et al., 2007; Isern et al., 2008) and one (line 30) was chosen for further analysis.
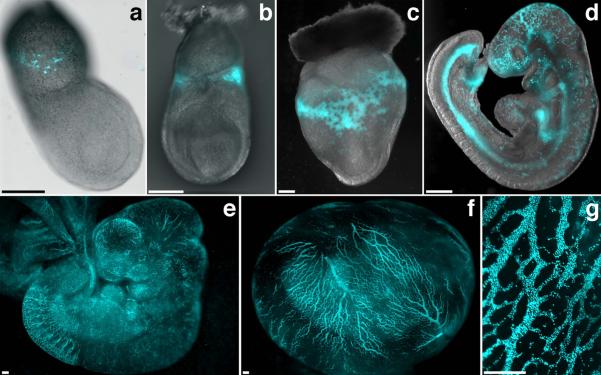
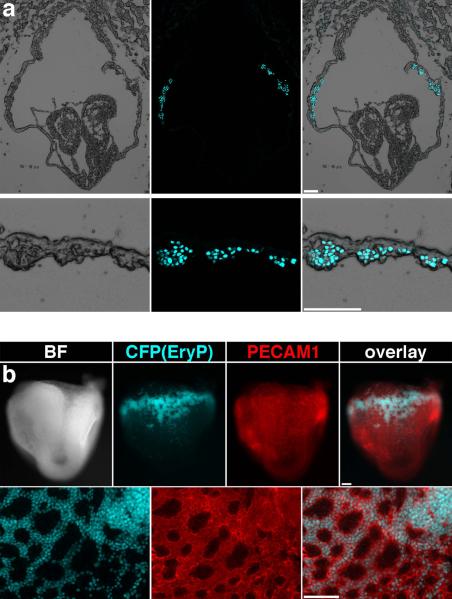
For a detailed characterization of the transgene expression pattern, we analyzed embryos harvested at different developmental stages using fluorescence microscopy. CFP expressing cells were first observed around the early streak stage (~E7.0) (Fig.1a). The CFP population expanded in the blood islands of late streak stage embryos (~E7.5; Fig.1b). As expected, a large increase in the number of CFP-positive cells was observed in the yolk sac at E8.5 (Fig.1c). After the onset of circulation, CFP-positive cells were seen throughout the developing vasculature (Fig.1d–g). Microscopic examination of cryosections from E8.25 transgenic embryos revealed that the CFP-expressing cells were localized exclusively in the blood islands of the yolk sac (Fig.2a). Analysis of whole E8.5 embryos stained with an antibody against PECAM1 (Fig.2b), an endothelial cell marker, showed that CFP-positive cells were present exclusively within the developing vasculature of the yolk sac surrounded by endothelial cells.
Figure 1. CFP expression during the development of ε-globin-H2B-CFP embryos.
(a–d) Overlay of bright field and CFP channel fluorescence for an E7.0 (a), E7.5 (b), E8.5 (c) and E9.5 (d) ε-globin-H2B-CFP transgenic embryo. (e–g) CFP fluorescent images of an E10.5 embryo (e), an E10.5 embryo in the yolk sac (f), and a detail of a E10.5 yolk sac (g). Images were acquired using a Zeiss AxioCam monochrome camera mounted on a Zeiss Axio Observer Z1 inverted microscope outfitted with a EC Plan-Neofluar 10×/0.30 objective (a) or on a Zeiss Lumar V12 stereomicroscope equipped with a NeoLumar S 1.5X FWD 30 mm objective (b–g). Scale bars, 200 μm.
Figure 2. CFP expression is restricted to the blood islands in E8.5 ε-globin-H2B-CFP embryos.
(a) Frontal (upper panels) and transverse (lower panels) cryosections of E8.5 ε-globin-H2B-CFP embryos showing CFP fluorescence in the blood islands. Images were acquired using a Zeiss AxioCam monochrome camera mounted on a Zeiss Axio Observer Z1 inverted microscope outfitted with a Plan-Neofluar 5×/0.15 or an EC Plan-Neofluar 10×/0.30 objective. (b) Images of a PECAM1-PE stained E8.5 ε-globin-H2B-CFP embryo (upper panels) and yolk sac (lower panels) showing CFP fluorescence exclusively within the developing vasculature. Images of whole embryos were acquired using a Zeiss AxioCam monochrome camera mounted on a Zeiss Lumar V12 stereomicroscope equipped with a NeoLumar S 1.5X FWD 30 mm objective. Photographs of yolk sac details were taken using a Zeiss Axio Observer Z1 inverted microscope outfitted with a Plan-Apochromat 20×/0.8 objective. Scale bars, 100 μm.
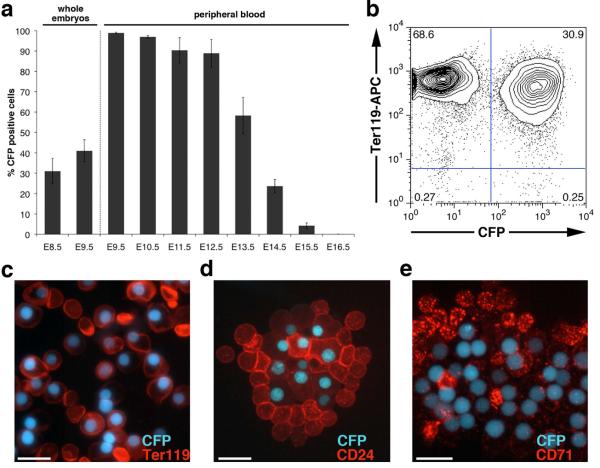
The abundance of CFP-positive cells in whole E8.5 and E9.5 embryos was measured using flow cytometry (Fig.3a). As expected (Isern et al., 2011), a large proportion of the cells from these embryos were CFP-positive (~30% positive at E8.5 and ~40% at E9.5, Fig. 3a). In peripheral blood (PB) at E9.5 and E10.5, >95% of the cells were CFP-positive (Fig. 3a). From E11.5–E15.5, when definitive erythroid cells are produced in large numbers by the fetal liver and the transgenic EryP lose their fluorescence through enucleation, the percentage of CFP-positive cells in the PB decreased progressively. At E16.5, a small number of CFP-positive cells (~0.03%) was still detected in blood; they were absent by E17.5 (Fig. 3a). These results are similar to those obtained for ε-globin-KGFP (Fraser et al., 2007) and -H2B-GFP (Isern et al., 2008) transgenic embryos. To further confirm that CFP transgene marks the primitive erythroid lineage, flow cytometric analysis of Ter119-labeled PB cells from E14.5 embryos was performed. As seen in Fig.3b, > 99% of the CFP-positive cells expressed the erythroid marker Ter119. Immunofluorescence analysis of E13.5 EryP revealed robust staining of the CFP positive cells was observed for the erythroid markers Ter119, CD24 and CD71 (Fraser et al., 2007) (Fig.3c–e).
Figure 3. CFP expression marks primitive erythroid cells in the ε-globin-H2B-CFP embryos.
(a) Quantitative analysis of the CFP expressing cells in whole embryos (E8.5 and E 9.5) and in embryonic peripheral blood (E9.5–E16.5) represented as mean of 3 to 6 biological replicates ± SD. (b) Quantification of Ter119 expression on CFP positive cells from E14.5 embryonic peripheral blood. Expression of the erythroid markers Ter119 (c), CD24 (d) and CD71 (e) on E13.5 CFP-EryP as assessed by immunofluorescence using anti-Ter119, anti-CD24 and anti-CD71 conjugated antibodies. Images were acquired using a Zeiss AxioCam monochrome camera mounted on a Zeiss Axioplan 2 microscope outfitted with a Plan-Neofluar 63×/1.25 oil objective Scale bars, 20 μm.
CFP expression marks primitive erythroid progenitors
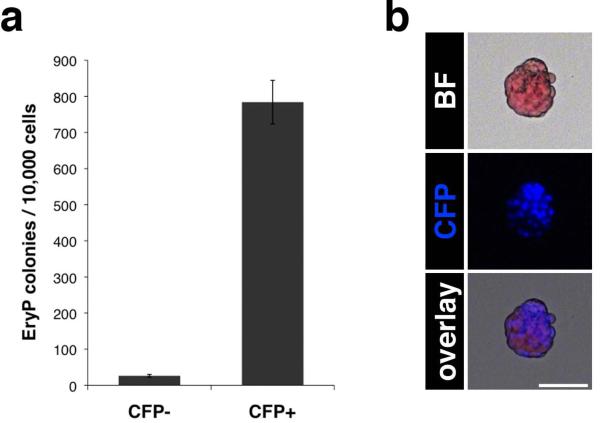
As CFP fluorescence was observed as early as E7.0, we anticipated that the CFP-positive cell population would contain primitive erythroid progenitors. To address this question, EryP progenitors assays were performed using FACS-sorted CFP-positive and -negative cells from E8.5 ε-globin-H2B-CFP embryos. The sorted cells were counted and plated in semisolid medium containing methylcellulose. Colonies were scored after 4–5 days. The results showed that nearly all EryP progenitor activity was present in the CFP positive population (Fig.4a). Like their progenitors, the cells found in the EryP colonies expressed CFP (Fig.4b).
Figure 4. Nearly all EryP progenitor activity is present in the CFP positive population.
(a) Representative EryP progenitor assay of CFP-positive and -negative cells sorted from E8.5 ε-globin-H2B-CFP embryos (mean of 3 technical replicates ± SD). The experiment was repeated at least 7 times, with comparable results. (b) Bright field and fluorescent images of an EryP colony. Images were acquired using a Zeiss AxioCam color camera mounted on a Zeiss Axio Observer Z1 inverted microscope and outfitted with a EC Plan-Neofluar 10x/0.30 objective. Scale bar, 50 μm.
Multicolor analysis of ε-globin-H2B-CFP transgenic embryos
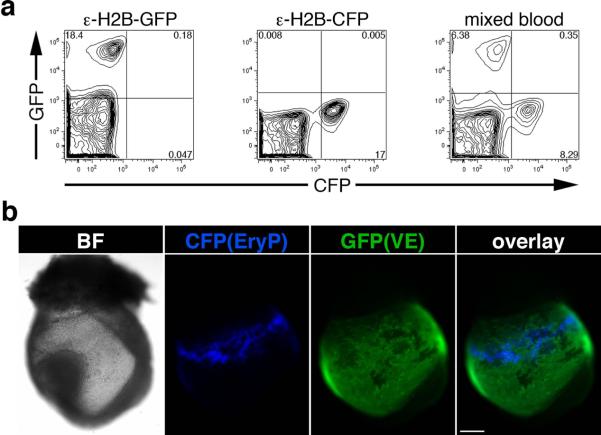
An important objective in generating the ε-globin-H2B-CFP line was to develop a new tool that would allow multicolor analysis. An important advantage of the CFP fluorophore is the contrast it provides when used in combination with other fluorescent proteins such as GFP and YFP. The combination of CFP plus GFP was tested using flow cytometry and fluorescence microscopy. Flow cytometic analysis of PB mixed from E14.5 ε-globin-H2B-GFP and ε-globin-H2B-CFP embryos (Fig.5a) showed good optical separation of these fluorophores. Microscopic analysis of double transgenic E8.5 ε-globin-H2B-CFP; Afp-GFP (Kwon et al., 2006) embryos also revealed clean separation of the two fluorophores.
Figure 5. Multicolor analysis of H2B-CFP in combination with GFP.
(a) FACS analysis of peripheral blood from E14.5 ε-globin-H2B-GFP and ε-globin-H2B-CFP embryos and of a mixed blood sample showing good separation of the fluorescent signals from the two transgenes. (b) Images of a double transgenic embryo (ε-globin-H2B-CFP; Afp-GFP) showing clear separation of CFP and GFP. Photographs were taken using a Zeiss AxioCam monochrome camera mounted on a Zeiss Axio Observer Z1 inverted microscope outfitted with a Plan-Neofluar 5x/0.15 objective. Scale bar, 200 μm.
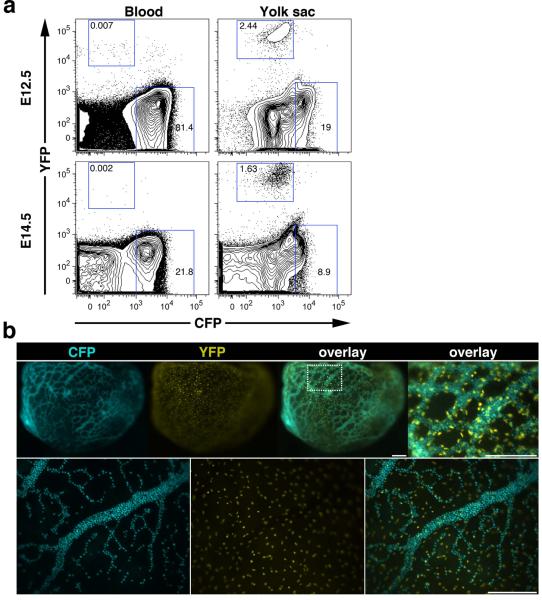
To test the CFP plus YFP color combination, flow cytometric analysis of PB and dispersed yolk sacs from E12.5 and E14.5 embryos ε-globin-H2B-CFP; Flk1-H2B-YFP (Fraser et al., 2005) double transgenic embryos was performed (Fig.6a). The Flk1-H2B-YFP transgene is expressed in endothelial cells (Fraser et al., 2005). A clear population of YFP-expressing cells was observed in endothelial cells of the yolk sac but not in the blood. As expected, the percentage of CFP-positive cells decreased in both the PB and yolk sac as the embryos developed (Fig. 6a). Fluorescent reporter expression in E9.0 and E10.5 embryos was also assessed by microscopy. YFP fluorescence in the nuclei of the yolk sac endothelium followed the contours of the vascular network and the vessels were filled with CFP-positive EryP (Fig.6b).
Figure 6. Multicolor analysis of ε-globin-H2B-CFP/Flk1-H2B-YFP double transgenic embryos.
(a) Flow cytometric analysis of peripheral blood and dispersed yolk sac from E12.5 and E14.5 embryos. (b) Images of an E9.0 ε-globin-H2B-CFP; Flk1-H2B-YFP double transgenic embryo, (upper panels) and images of part of an E10.5 ε-globin-H2B-CFP; Flk1-H2B-YFP yolk sac (lower panels). Top RIGHT overlay panel is a magnified view of the boxed area of the yolk sac from the adjacent panel. The images were acquired using a Zeiss AxioCam monochrome camera mounted on a Zeiss Lumar V12 stereomicroscope equipped with a NeoLumar S 1.5X FWD 30 mm objective. Scale bars, 200 μm.
Analysis of EryP proliferation in the ε-globin-H2B-CFP embryos
The vital nuclear dye DRAQ5 (Fraser et al., 2007) was used in combination with the ε-globin-H2B-CFP transgene to examine the cell cycle distribution of EryP from E8.5 to E13.5. The histograms in Fig.7a represent the accumulation of DRAQ5 in the CFP-positive cells. From E8.5 to E10.5, ~40% of EryP are in the S and G2/M phases of the cell cycle, consistent with the high proliferative activity seen in EryP at these stages. The percentage of cells in S and G2/M decreased as the cells matured. A sharp drop in the number of cycling cells was observed from E11.5 to E12.5. By E13.5, almost all the cells had accumulated in G0/G1, with only ~6% remaining in S and G2/M. An overlay of the histograms for E8.5, E10.5 and E12.5 (Fig.7b) emphasizes the rapid decrease in the number of EryP in the S and G2/M phases of the cell cycle over this 4 day period. The histone H2B-CFP fusion protein coats the chromatin at all phases of the cell cycle (e.g. see images of E8.5 EryP erythroblasts, Fig. 7c).
Figure 7. Analysis of primitive erythroid cell proliferation using ε-globin-H2B-CFP transgenic embryos.
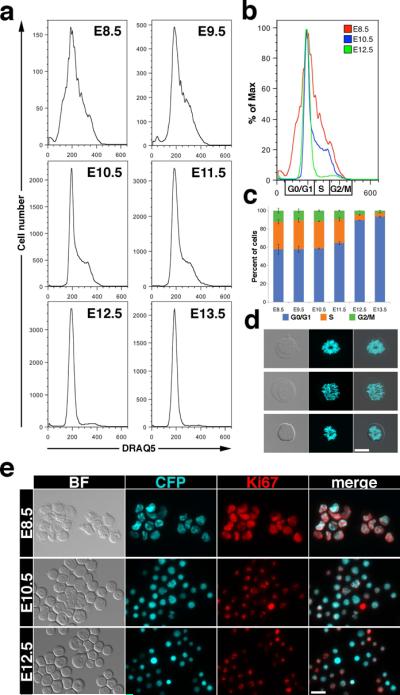
(a) Histograms depicting DNA profiles (DRAQ5 staining) of CFP positive cells from E8.5–E12.5 ε-globin-H2B-CFP embryos. (b) Overlay of the histograms corresponding to E8.5, E10.5 and E12.5 embryos. Cell cycle distribution is marked below the histogram. (c) Quantification of EryP cell cycle distribution during their maturation from E8.5 to E13.5. The quantification was done based on the gating showed in b. (d) Bright field, CFP fluorescence channel and overlay images of condensed chromatin marked by CFP in wet preparations of E8.5 ε-globin-H2B-CFP mitotic cells. (e) Expression of Ki67 in cytospun CFP-positive cells from E8.5 embryos and in peripheral blood cells from E10.5 and E12.5 embryos. Photographs were acquired using a Zeiss AxioCam monochrome camera mounted on a Zeiss Axio Observer Z1 inverted microscope outfitted with a Plan-Apochromat 20x/0.8 objective. Scale bars, 20 μm.
To measure proliferation of the EryP lineage, EryP were cytospun onto slides and stained with an antibody against Ki67, a marker of proliferation. Strong nuclear staining for Ki67 was observed in progenitor stage (E8.5) EryP (Fig. 7d). The progressive nuclear condensation observed during EryP maturation was associated with reduced Ki67 expression (Fig. 7d). The cell cycle distribution and Ki67 staining results demonstrate proliferation arrest in EryP as they mature and prepare for enucleation and are consistent with previous cell cycle and proliferation studies performed on later (circulation) stage EryP (De la Chapelle et al., 1969; Sangiorgi et al., 1990). The cell cycle status and proliferation status of progenitor (E7.5–E8.5) and early circulation (E9.5) EryP have not been examined previously.
EryP enucleation in the mouse placenta
EryP have been found in the mouse fetal liver in association with macrophages (Isern et al., 2008; McGrath et al., 2008). A recent study suggested that macrophages present in the human placenta are involved in the terminal maturation of EryP (Van Handel et al., 2010). To examine a possible involvement of placental macrophages in EryP maturation in the mouse, we analyzed placental sections from E14.5 ε-globin-H2B-CFP embryos for expression of F4/80 using immunofluorescence microscopy (Fig.8c) and cells from dispersed placentas using flow cytometry (Fig.8d). Fetal livers from the same embryos were used as positive controls for F4/80 staining for both imaging (Fig.8a) and flow cytometry (Fig.8b). In the fetal liver, F4/80-positive macrophages were abundant (~15%, Fig. 8b) and frequently contained CFP-positive nuclei (~20% of macrophages). In contrast, in the placenta, these macrophages were scarce (~1%, Fig. 8c, d) and smaller in size (Fig. 8, compare panels a and c) and fewer than 10% (<<1% of total cells) contained CFP-positive nuclei. Images of placental macrophages that appear to contain CFP-positive nuclei are shown in Fig. 8e. These results suggest that placental macrophages are able to engulf EryP nuclei but that the placenta is not a major site of EryP enucleation in the mouse embryo.
Figure 8. E14.5 placental macrophages engulf primitive erythroid cells nuclei.
Fluorescence images of F4/80 stained fetal liver (a) and placenta (c) sections from E14.5 ε-globin-H2B-CFP embryos, with magnified views of the boxed regions. DAPI staining of the sections is also shown. Flow cytometry plots of F4/80 stained cells from dispersed fetal liver (b) and placenta (d) of E14.5 ε-globin-H2B-CFP embryos. (c) Images of F4/80 positive macrophages with engulfed CFP-positive nuclei. Arrowheads indicate the spaces occupied by the CFP-positive nuclei inside the macrophages. Photographs were taken using a Zeiss AxioCam monochrome camera mounted on a Zeiss Axio Observer Z1 inverted microscope outfitted with a Plan-Apochromat 20x/0.8 objective (a and c) or a Plan-Apochromat 63x/1.4 oil objective (e). Scale bars, 20 μm.
SUMMARY
The development of the primitive erythroid lineage, the first hematopoietic lineage to appear in the mouse embryo, can be monitored using transgenic mouse lines in which human ε-globin regulatory elements drive fluorescent reporter expression specifically in EryP. Here, we report the development of a new transgenic mouse line in which the nuclei of EryP are tagged with a histone H2B-CFP fusion protein. CFP-labeled EryP were monitored by flow cytometry and imaging. The H2B-CFP reporter could be combined with other fluorescent reporters to follow simultaneously the development of EryP and cells of other lineages (here, visceral endoderm marked by Afp-GFP or endothelial cells marked by Flk1-H2B-YFP). We used the ε-globin-H2B-CFP transgenic mouse to examine the cell cycle status and proliferative behavior of EryP and to evaluate the phagocytosis of extruded EryP nuclei by macrophages in the fetal liver and placenta. This line will be a useful tool for analysis of EryP defects in the context of targeted gene mutations (e.g. see ref. Isern et al., 2010), particularly those carrying a GFP reporter.
MATERIALS AND METHODS
Generation of ε-globin-H2B-CFP plasmid and transgenic mice
The construct containing the ε-globin-H2B-CFP transgene was designed using the same strategy as that used for the ε-globin-H2B-GFP transgene (Isern et al., 2008). The plasmid was digested using KpnI and NotI restriction enzymes (New England BioLabs, Ipswich, MA) to remove the bacterial backbone. Pronuclear injection of the purified transgene was performed at the Mount Sinai Mouse Genetics Shared Resource Facility. Founder mice were identified by genotying using the following primers for polymerase chain reaction (PCR): Fwd 5'-CACCATCTTCTTCAAGGACGAC-3' Rev 5'-TTCTCGTTGGGGTCTTTGC-3'. The resulting transgenic mice were maintained as hemiyzygotes or homozygotes on an ICR background. The ε-globin-H2B-CFP transgenic line will be made available to the research community upon acceptance of the manuscript.
Embryo dissection and collection of embryonic blood
Mouse embryo dissections were performed as described in (Fraser et al., 2010). The morning of detection of the vaginal plug was considered day 0.5 of gestation. Pregnant females were euthanized by asphyxiation with CO2 according to institutional and federal guidelines. Uteri were removed and washed with phosphate buffered saline (PBS). Embryos were dissected free of decidual tissue in fluorescence-activated cell sorting (FACS) buffer (PBS containing 5% fetal bovine serum, FBS; Hyclone, Logan, UT). The embryos were rinsed in FACS buffer to remove contaminating maternal blood, transferred to dishes containing FACS buffer with 12.5 μg/ml heparin (Sigma Aldrich, St Louis, MO), and exsanguinated by severing the vitelline and umbilical vessels, then allowing the blood to drain into one well of a 12- or 24-well plate containing 1 ml FACS buffer plus heparin.
Flow cytometry and cell sorting
ε-globin-H2B-CFP transgenic embryos (E9.5–E16.5) were dissected at the indicated times and blood was collected as described above. Younger embryos (E8.5–E9.5) were digested by treatment with collagenase (Sigma Aldrich, St Louis, MO) for 5 min at 37°C followed by mechanical disruption using gentle pipetting. Fetal livers (FL) and placentae (PL) were dissected, disrupted using trituration, and filtered through a 70 μm cell strainer (BD Biosciences, San Diego, CA) to produce a single-cell suspension. Cells from embryonic peripheral blood (PB), FL and PL were washed and stained for flow cytometric analysis as described previously (Isern et al., 2011). PB cells were stained with Ter119-APC conjugated monoclonal antibody (eBioscience, San Diego, CA). Cells from FL and PL were stained with F4/80-AlexaFluor647 antibody (Serotec, Oxford, UK). DRAQ5 (eBioscience, San Diego, CA) staining for cell cycle analysis was performed according to the manufacturer's instructions. Samples were analyzed using an LSRII cell analyzer (Becton Dickinson, Franklin Lakes, NJ). Data were analyzed using the FlowJo Version 8.8.6 software package (Tree Star Inc., Eugene, OR). Cell sorting was performed using either an Influx (Becton Dickinson, Franklin Lakes, NJ) or a MoFlo cell sorter (DakoCytomation, Glostrup, Denmark). Analytical flow cytometry and cell sorting were performed at the Mount Sinai Flow Cytometry Shared Resource Facility.
Primitive erythroid colony assay
Primitive erythroid progenitor assays were performed as described previously (Baron and Mohn, 2005). Sorted cells were plated in duplicate or triplicate in 35 mm dishes (Becton Dickinson, Franklin Lakes, NJ) at a density of 2,000–10,000 cells/ml. The plating medium contained 1% (w/v) methylcellulose in Iscove's Modified Dulbecco's Media (IMDM) with 10% plasma-derived serum (PDS; Animal Technologies, Tyler, TX); 5% protein free hybridoma medium (PFHM-II), 1% Penicillin/Streptomycin, and 2 mM glutamine (all from GIBCO BRL, Invitrogen, Carlsbad, CA); 25 μg/ml ascorbic acid, 0.45 mM α-monothioglycerol (Sigma Aldrich, St Louis, MO); and 4 U/ml human erythropoietin (Epogen, Amgen, Thousand Oaks, CA). Cultures were maintained at 37°C and 5% CO2 in a humidified incubator and EryP colonies were scored on day 5. Primitive erythroid colonies were identified and scored under the microscope as round red clusters containing more than 50 cells.
Immunohistochemistry
For Ki67 immunostaining of primitive erythroblasts, cytospun cells were first dehydrated for 2 min in methanol, washed twice with PBS, then and fixed and permeabilized in one step using 4% paraformaldehyde and 0.5% Triton X-100 in PBS for 10 min at room temperature. The cells were washed twice with PBS and incubated for 30 min in PBS containing 5% FBS (PBSF) followed by two additional washing steps using PBS. The samples were incubated with the primary antibody (Ki67, Abcam, Cambridge, MA) or the appropriate isotype control for 60 min at room temperature. Subsequently, the cells were washed three times with PBSF and incubated for 60 min with the secondary antibody (anti-rabbit AlexaFluor-647, Molecular Probes, Invitrogen, Carlsbad, CA). The cells were washed three times with PBS, rinsed in water and mounted with Vectashield mounting media with DAPI (Vector Labs, Burlingame, CA). Tissue cryosections were prepared as described by Rhodes et al., 2008. Staining of 10 μm FL and PL cryosections was performed as follows. The sections were incubated for 5 min in PBS plus 0.05% Tween 20 (Sigma Aldrich, St Louis, MO), washed three times with PBS and then incubated for 60 min in blocking buffer (PBS containing 5% normal goat serum). Next, the samples were incubated for 60 min with biotin-conjugated F4/80 antibody (eBioscience, San Diego, CA) or with the appropriate isotype control diluted in blocking buffer. The sections were washed three times with blocking buffer and incubated for 60 min with streptavidin-APC conjugated secondary antibody (eBioscience, San Diego, CA), followed by three washes with PBS washings. Samples were mounted with coverslips using Vectashield mounting medium with DAPI.
Imaging
Images were acquired using a color (MRc) or monochrome (MRm) Zeiss AxioCam camera coupled to a Zeiss Lumar V12 stereomicroscope, a Zeiss Axioplan 2 microscope or a Zeiss Axio Observer Z1 inverted microscope. The figures were prepared using Adobe Photoshop software.
ACKNOWLEDGEMENTS
We thank Dr. A.-K. Hadjantonakis for an H2B-CFP fusion construct and both Dr. Hadjantonakis and Dr. Sonja Nowotschin for helpful discussions. This work was supported by NIH RO1 DK52191 to M.H.B. Transgenic mice were produced by the Mount Sinai Mouse Genetics Shared Research Facility. We thank the Mount Sinai Flow Cytometry Shared Resource Facility for assistance with cell sorting.
REFERENCES
- Baron MH, Isern J, Fraser ST. The embryonic origins of erythropoiesis in mammals. Blood. 2012;119:4828–4837. doi: 10.1182/blood-2012-01-153486. [DOI] [PMC free article] [PubMed] [Google Scholar]
- Baron MH, Mohn D. Mouse embryonic explant culture system for analysis of hematopoietic and vascular development. Methods Mol Med. 2005;105:231–256. doi: 10.1385/1-59259-826-9:231. [DOI] [PubMed] [Google Scholar]
- Belaoussoff M, Farrington SM, Baron MH. Hematopoietic induction and respecification of A-P identity by visceral endoderm signaling in the mouse embryo. Development. 1998;125:5009–5018. doi: 10.1242/dev.125.24.5009. [DOI] [PubMed] [Google Scholar]
- De la Chapelle A, Fantoni A, Marks PA. Differentiation of mammalian somatic cells: DNA and hemoglobin synthesis in fetal mouse yolk sac erythroid cells. Proc Natl Acad Sci U S A. 1969;63:812–819. doi: 10.1073/pnas.63.3.812. [DOI] [PMC free article] [PubMed] [Google Scholar]
- Dyer MA, Farrington SM, Mohn D, Munday JR, Baron MH. Indian hedgehog activates hematopoiesis and vasculogenesis and can respecify prospective neurectodermal cell fate in the mouse embryo. Development. 2001;128:1717–1730. doi: 10.1242/dev.128.10.1717. [DOI] [PubMed] [Google Scholar]
- Dzierzak E, Speck NA. Of lineage and legacy: the development of mammalian hematopoietic stem cells. Nat Immunol. 2008;9:129–136. doi: 10.1038/ni1560. [DOI] [PMC free article] [PubMed] [Google Scholar]
- Fantoni A, De la Chapelle A, Rifkind RA, Marks PA. Erythroid cell-development in fetal mice: synthetic capacity for different proteins. J Mol Biol. 1968;33:79–91. doi: 10.1016/0022-2836(68)90282-9. [DOI] [PubMed] [Google Scholar]
- Forrester WC, Novak U, Gelinas R, Groudine M. Molecular analysis of the human beta-globin locus activation region. Proc Natl Acad Sci U S A. 1989;86:5439–5443. doi: 10.1073/pnas.86.14.5439. [DOI] [PMC free article] [PubMed] [Google Scholar]
- Fraser ST, Hadjantonakis AK, Sahr KE, Willey S, Kelly OG, Jones EA, Dickinson ME, Baron MH. Using a histone yellow fluorescent protein fusion for tagging and tracking endothelial cells in ES cells and mice. Genesis. 2005;42:162–171. doi: 10.1002/gene.20139. [DOI] [PMC free article] [PubMed] [Google Scholar]
- Fraser ST, Isern J, Baron MH. Maturation and enucleation of primitive erythroblasts is accompanied by changes in cell surface antigen expression patterns during mouse embryogenesis. Blood. 2007;109:343–352. doi: 10.1182/blood-2006-03-006569. [DOI] [PMC free article] [PubMed] [Google Scholar]
- Fraser ST, Isern J, Baron MH. Use of transgenic fluorescent reporter mouse lines to monitor hematopoietic and erythroid development during embryogenesis. Methods Enzymol. 2010;476:403–427. doi: 10.1016/S0076-6879(10)76022-5. [DOI] [PubMed] [Google Scholar]
- Isern J, Fraser ST, He Z, Baron MH. The fetal liver is a niche for maturation of primitive erythroid cells. Proc Natl Acad Sci U S A. 2008;105:6662–6667. doi: 10.1073/pnas.0802032105. [DOI] [PMC free article] [PubMed] [Google Scholar]
- Isern J, Fraser ST, He Z, Zhang H, Baron MH. Dose-dependent regulation of primitive erythroid maturation and identity by the transcription factor Eklf. Blood. 2010;116:3972–3980. doi: 10.1182/blood-2010-04-281196. [DOI] [PMC free article] [PubMed] [Google Scholar]
- Isern J, He Z, Fraser ST, Nowotschin S, Ferrer-Vaquer A, Moore R, Hadjantonakis A-K, Schulz V, Tuck D, Gallagher PG, Baron MH. Single lineage transcriptome analysis reveals key regulatory pathways in primitive erythroid progenitors in the mouse embryo. Blood. 2011;117:4924–4934. doi: 10.1182/blood-2010-10-313676. [DOI] [PMC free article] [PubMed] [Google Scholar]
- Kingsley PD, Malik J, Emerson RL, Bushnell TP, McGrath KE, Bloedorn LA, Bulger M, Palis J. “Maturational” globin switching in primary primitive erythroid cells. Blood. 2006;107:1665–1672. doi: 10.1182/blood-2005-08-3097. [DOI] [PMC free article] [PubMed] [Google Scholar]
- Kingsley PD, Malik J, Fantauzzo KA, Palis J. Yolk sac-derived primitive erythroblasts enucleate during mammalian embryogenesis. Blood. 2004;104:19–25. doi: 10.1182/blood-2003-12-4162. [DOI] [PubMed] [Google Scholar]
- Kwon GS, Fraser ST, Eakin GS, Mangano M, Isern J, Sahr KE, Hadjantonakis AK, Baron MH. Tg(Afp-GFP) expression marks primitive and definitive endoderm lineages during mouse development. Dev Dyn. 2006;235:2549–2558. doi: 10.1002/dvdy.20843. [DOI] [PMC free article] [PubMed] [Google Scholar]
- Lucitti JL, Jones EA, Huang C, Chen J, Fraser SE, Dickinson ME. Vascular remodeling of the mouse yolk sac requires hemodynamic force. Development. 2007;134:3317–3326. doi: 10.1242/dev.02883. [DOI] [PMC free article] [PubMed] [Google Scholar]
- McGrath KE, Kingsley PD, Koniski AD, Porter RL, Bushnell TP, Palis J. Enucleation of primitive erythroid cells generates a transient population of “pyrenocytes” in the mammalian fetus. Blood. 2008;111:2409–2417. doi: 10.1182/blood-2007-08-107581. [DOI] [PMC free article] [PubMed] [Google Scholar]
- Palis J, Malik J, McGrath KE, Kingsley PD. Primitive erythropoiesis in the mammalian embryo. Int J Dev Biol. 2010;54:1011–1018. doi: 10.1387/ijdb.093056jp. [DOI] [PubMed] [Google Scholar]
- Rhodes KE, Gekas C, Wang Y, Lux CT, Francis CS, Chan DN, Conway S, Orkin SH, Yoder MC, Mikkola HK. The emergence of hematopoietic stem cells is initiated in the placental vasculature in the absence of circulation. Cell Stem Cell. 2008;2:252–263. doi: 10.1016/j.stem.2008.01.001. [DOI] [PMC free article] [PubMed] [Google Scholar]
- Sangiorgi F, Woods CM, Lazarides E. Vimentin downregulation is an inherent feature of murine erythropoiesis and occurs independently of lineage. Development. 1990;110:85–96. doi: 10.1242/dev.110.1.85. [DOI] [PubMed] [Google Scholar]
- Steiner R, Vogel H. On the kinetics of erythroid cell differentiation in fetal mice. I. Microspectrophotometric determination of the hemoglobin content in erythroid cells during gestation. J Cell Physiol. 1973;81:323–338. doi: 10.1002/jcp.1040810305. [DOI] [PubMed] [Google Scholar]
- Trepicchio WL, Dyer MA, Baron MH. Developmental regulation of the human embryonic beta-like globin gene is mediated by synergistic interactions among multiple tissue- and stage-specific elements. Mol Cell Biol. 1993;13:7457–7468. doi: 10.1128/mcb.13.12.7457. [DOI] [PMC free article] [PubMed] [Google Scholar]
- Van Handel B, Prashad SL, Hassanzadeh-Kiabi N, Huang A, Magnusson M, Atanassova B, Chen A, Hamalainen EI, Mikkola HK. The first trimester human placenta is a site for terminal maturation of primitive erythroid cells. Blood. 2010;116:3321–3330. doi: 10.1182/blood-2010-04-279489. [DOI] [PMC free article] [PubMed] [Google Scholar]


