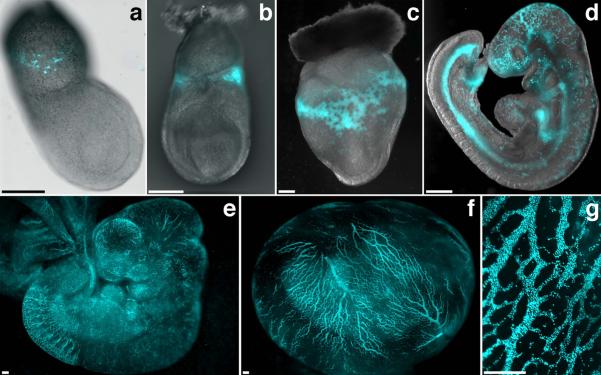
Figure 1. CFP expression during the development of ε-globin-H2B-CFP embryos.
(a–d) Overlay of bright field and CFP channel fluorescence for an E7.0 (a), E7.5 (b), E8.5 (c) and E9.5 (d) ε-globin-H2B-CFP transgenic embryo. (e–g) CFP fluorescent images of an E10.5 embryo (e), an E10.5 embryo in the yolk sac (f), and a detail of a E10.5 yolk sac (g). Images were acquired using a Zeiss AxioCam monochrome camera mounted on a Zeiss Axio Observer Z1 inverted microscope outfitted with a EC Plan-Neofluar 10×/0.30 objective (a) or on a Zeiss Lumar V12 stereomicroscope equipped with a NeoLumar S 1.5X FWD 30 mm objective (b–g). Scale bars, 200 μm.

