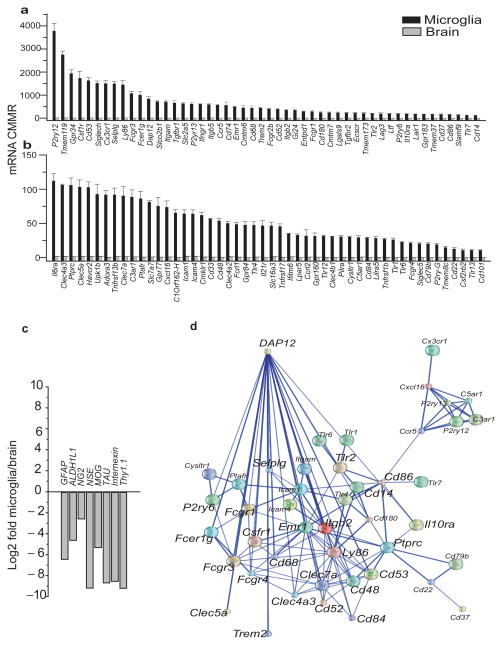
Figure 1. The microglial Sensome identified by direct RNA sequencing.
Of the 21025 transcripts measured, we used gene ontology (GO) analysis and identified 1299 potential sensome genes. Of these, we selected the top 100 transcripts with the highest enrichment of microglia/brain and termed this gene collection as the microglial “Sensome”. a–b. Expression levels of genes of the microglial Sensome in mRNA copies per million reads (CMMR) in microglia and brain. Values are mean ± SD of three different experiments done with microglia pooled from 22, 10 and 20 mice, respectively. and three pools of RNA from 2 brains each. For differences in expression between microglia and brain p<0.00001 for all Sensome genes shown in graph. Data can be found in Supplementary Table 1. c. Log2Fold change (graybars) of non-microglial genes specific for neurons, astrocytes and oligodendrocytes and show “derichment” in microglia compared to whole brain. d. Network analysis of the microglial Sensome by STRING identified a DAP12 centered pathway with 44/100 genes with direct or indirect interaction with DAP12. Of these, 24 have a direct interaction with Dap12 and are highlighted using a largerfont.

