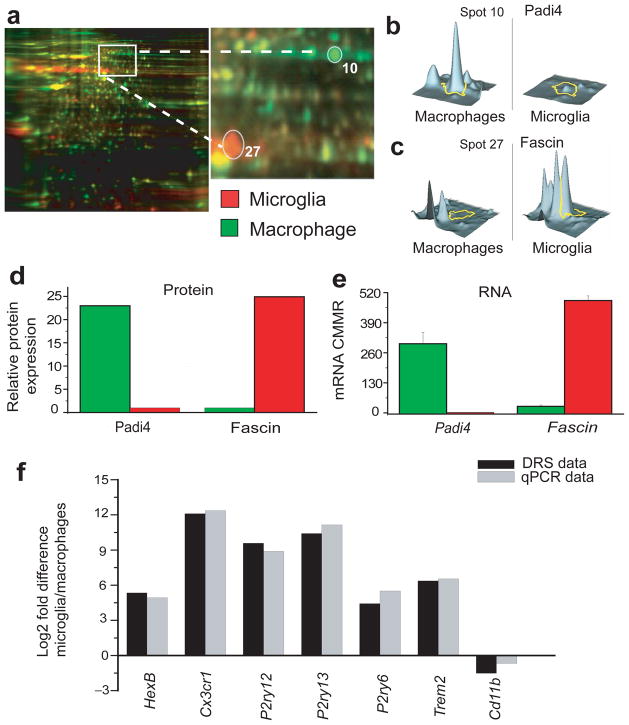
Figure 5. Proteomic analysis of microglia and macrophages.
a. Fluorescent 2D-DIGE of microglia (labeled in red) and macrophages (labeled in green) proteins showing common (labeled in yellow) and unique proteins for each cell type. Right panel shows an enlarged view of the area delineated in left panel. b. quantitative diagram of spot # 10 identified by mass spectrometry as Padi4 showing lower level of expression in microglia compared to macrophages. c. quantitative diagram of spot # 27 identified by mass spectrometry as fascin showing higher level of expression in microglia compared to macrophages. d, e. Comparison of protein levels (measured by mass spectrometry) and mRNA levels (measured by DRS) of Padi4 and fascin in macrophages and microglia. (DRS values are mean ± SD of three different experiments done with microglia pooled from 22, 10 and 20 mice, and from three pools of macrophages from 10 mice per pool, protein values are from pooled microglia and macrophages isolated from 70 and 50 mice, respectively). f. Validation by qPCR of some genes obtained with DRS on new cohorts of mice. The new cohorts comprised 5 sorted microglia pools and 6 macrophage pools from sorting of six sets using five mice per set. Ratio values for qPCR and DRS data represent the ratio of gene of interest to B2-micoglobulin expression. Data are plotted as log2 fold differencebetween microglia/macrophageratio values.

