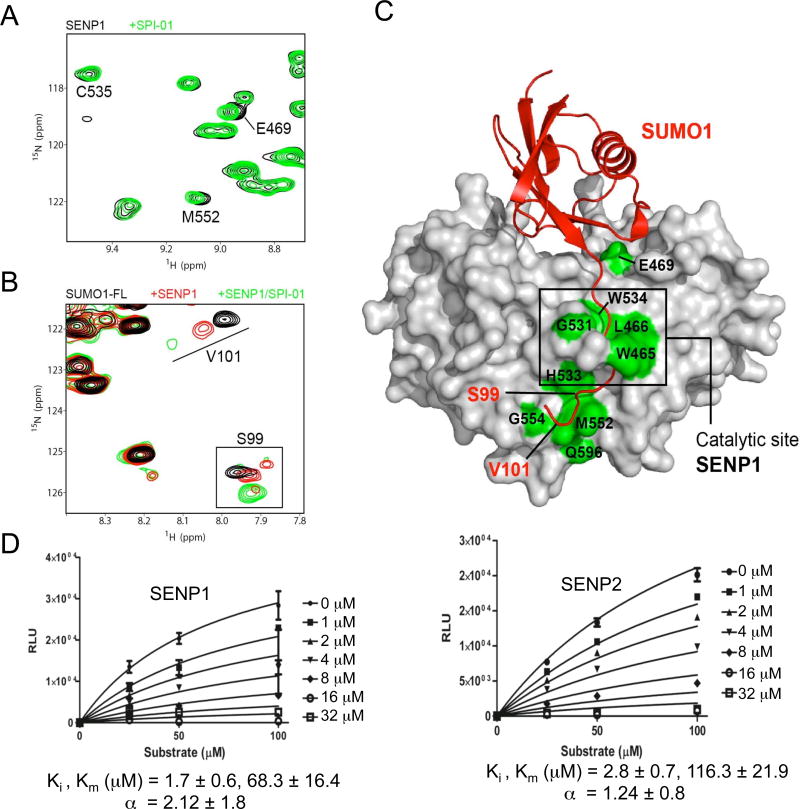
Figure 2. Investigation of the inhibitory mechanism using NMR and enzyme kinetic analysis.
(A) Superimposition of a section of the 2D1H-15N-HSQC spectra of the catalytically inactive C603S mutant of human SENP1 in the absence (black cross-peaks) and presence of SPI-01 (green cross-peaks) at 25 °C. Perturbed representative cross-peaks at or near the catalytic site of SENP1 are labeled. (B) Superimposition of a section of the 2D1H-15N-HSQC spectra of SUMO-1 precursor showing labeled peaks of the C-terminal residues when free (black) and bound to SENP1-C603S (red) or both SENP1-C603S and SPI-01 (green) at 35 °C. (C) All SPI-01 perturbed residues on SENP1 are labeled and colored in green on the surface representation of SENP1 in complex with SUMO-1 precursor (pdb ID: 2IY1). Perturbed residues that are located in the vicinity of the catalytic center of SENP1 or the C-terminus of precursor SUMO-1 are labeled in black and red, respectively. (D) Enzyme kinetic measurements for SPI-01 indicate a non-competitive mode of inhibition. The data were fit to obtain the indicated kinetic parameters (α, Ki and Km) using Graphpad Prism. Lineweaver-Burk plot analysis of the data also confirmed non-competitive inhibition.

