Table 2.
Quantitation of alveolar septa thickness in lungs from mice treated with soy and radiation
| Ratio of Alveolar Septa Area/20X Field | |||||
|---|---|---|---|---|---|
| Treatment | Regular Septaa | Thick Septab | Regular Septac | ||
| Area Ratio Range | 0.3 – 0.50 | 0.51 – 0.65 | 0.3–0.50 | ||
| Proportion | Percent | Proportion | Percent |

|
|
| Tumor-Bearing Lungs Control | 13/20 | 65% | 7/20 | 35% | |
| Radiation | 11/20 | 55% | 9/20 | 45% | |
| Soy | 17/20 | 85% | 3/20 | 15% | Thick Septad 0.51–0.65 |
| Radiation + Soy | 14/20 | 70% | 6/20 | 30% |

|
| Normal Lung | 16/20 | 80% | 4/20 | 20% | |
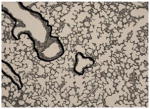
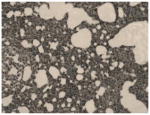
Using software analysis of H&E slides, the ratio of alveolar septa area relative to the total area of 20X field was quantified in 20 fields of 20X while contouring and excluding bronchioles and large vessels (see insetc). Data were stratified by using a ratio of 0.3–0.50 to define regular normal septaa, c and 0.51–0.65 to define thick septab, d which is indicative of pneumonitis (see insetd). Data computed on lungs from 2 representative mice are presented.
