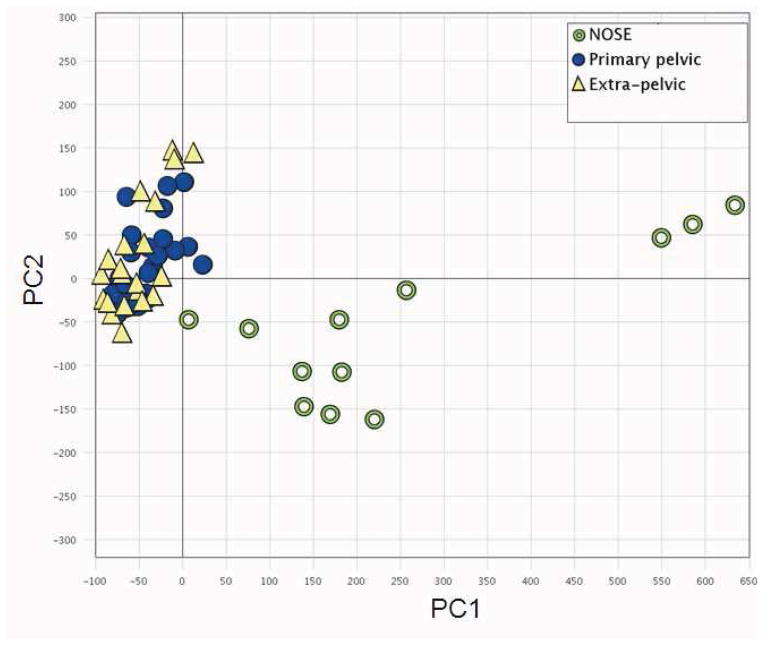
Figure 1.
Comparison of overall expression profiles across all samples. Results for principal component analyses (PCA) of gene expressions in normal ovarian surface epithelium (NOSE; green circles), primary pelvic (filled blue circles), and extra-pelvic (yellow triangles) samples are shown. The first principal component (PC1) explains 35.4% of the variation, whereas the second (PC2) explains 6.3%.

