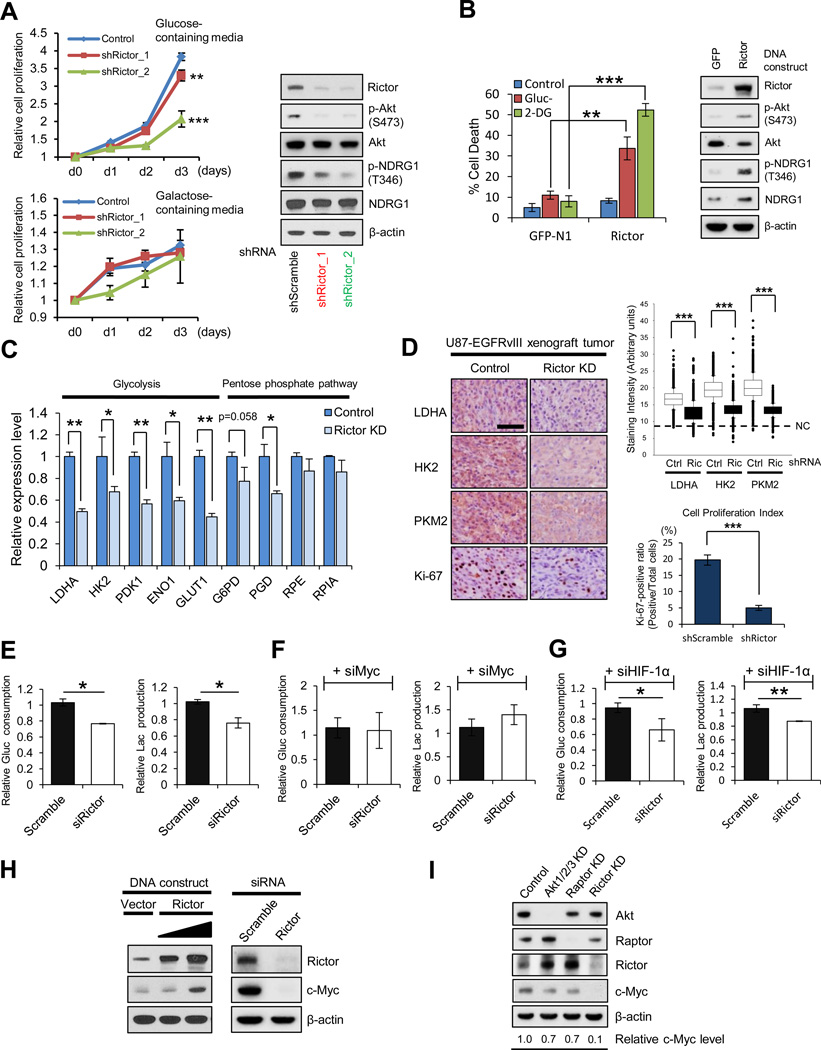
Figure 1. mTORC2 Is Required for GBM Growth in Glucose through c-Myc.
(A) Growth curves of scramble or Rictor knockdown (KD) U87-EGFRvIII cells, cultured in media containing glucose or galactose. Error bars, ± SD. Immunoblot showing the verification of Rictor KD in U87-EGFRvIII cells.
(B) Cell deaths of GFP or Rictor overexpressing U87 cells after 48 h treatment with glucose deprivation (Gluc-) or the glycolytic inhibitor, 2-Deoxy-D-glucose (2-DG, 10 mM). Immunoblot showing the verification of Rictor overexpression in U87 cells.
(C) mRNA levels of glycolysis and pentose phosphate pathway (PPP) enzymes in control or Rictor KD U87-EGFRvIII cells.
(D) Cell-based immunohistochemical analysis for glycolytic enzymes and a proliferative marker Ki-67 in U87-EGFRvIII xenograft tumors with scramble or Rictor shRNA (n = 3). Scale bar, 50 µm. NC denotes the averaged staining intensity obtained by negative control of each sample.
(E-G) Relative glucose consumption and lactate production in control versus Rictor KD U87-EGFRvIII cells (E), combined with c-Myc KD (F) or HIF-1α KD (G).
(H) Biochemical analysis of c-Myc expression for Rictor overexpression in U87 cells and Rictor KD in U87-EGFRvIII cells.
(I) Immunoblot analysis of c-Myc in U87-EGFRvIII cells with indicated siRNAs regarding Akt, mTORC1 (Raptor) and mTORC2 (Rictor).
All error bars except growth curves (A), SEM. See also Figure S1.

