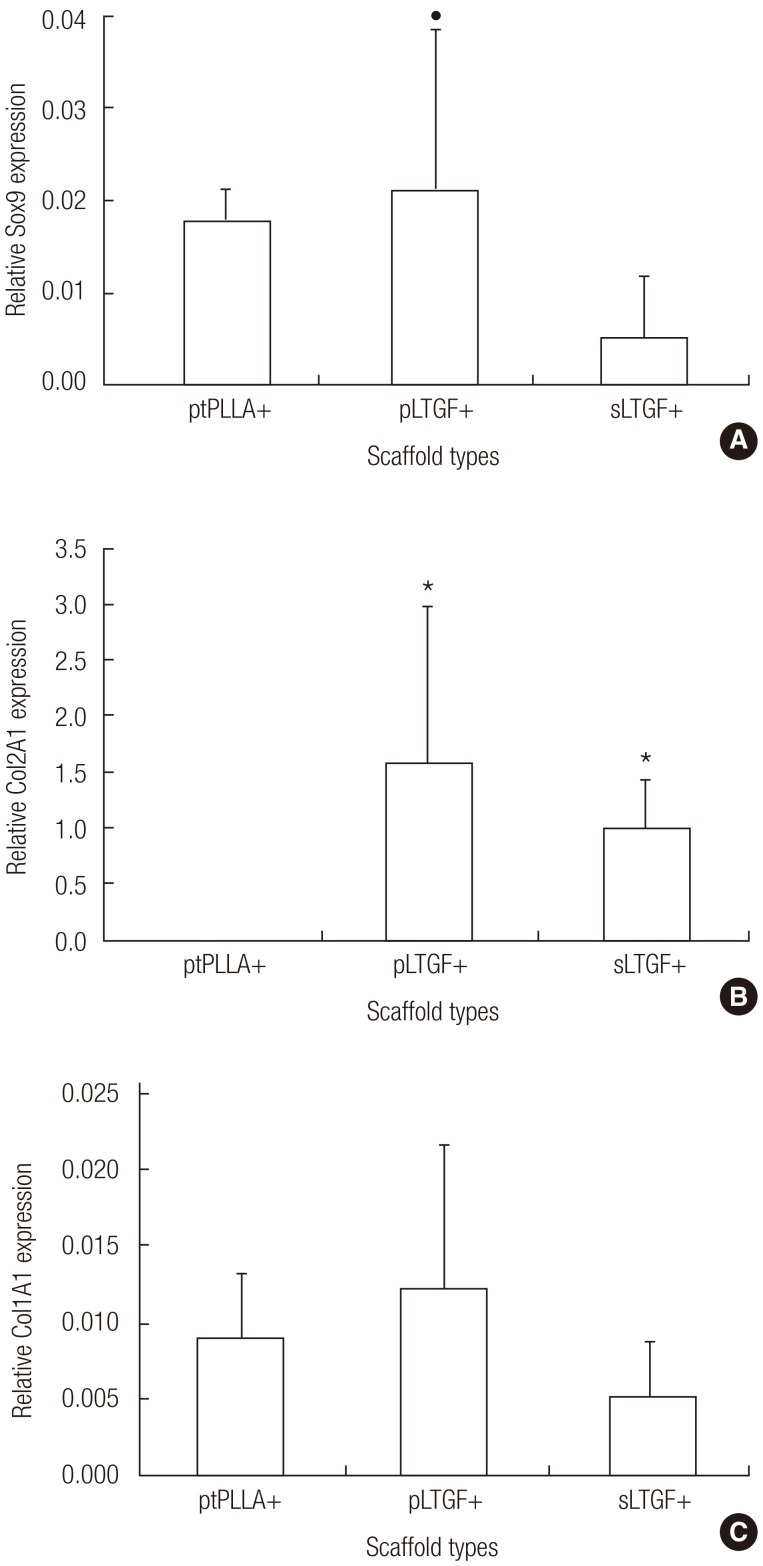
Fig. 8.
Gene expression of in vivo cultured chondrocytes
This figure reveals the effects of various scaffold types on in vivo gene expression of chondrocytes at six weeks. Expression levels of (A) Sox9, (B) Col2A1, and (C) Col1A1 were normalised to the 18S gene and day 0 expression levels. The average fold changes±standard deviation are presented (n=4). The following symbols represent significant differences (Mann-Whitney U test, P<0.05) in the (*) ptPLLA+ and (●) sLTGF+ groups. PLLA, untreated poly(L-lactide) scaffold; ptPLLA, plasma treated PLLA scaffold; pLTGF, random immobilisation of latent TGF-β1 on plasma treated PLLA scaffold; sLTGF, orientated immobilisation of latent TGF-β1 using sulfo-SMCC on plasma treated PLLA scaffold.

