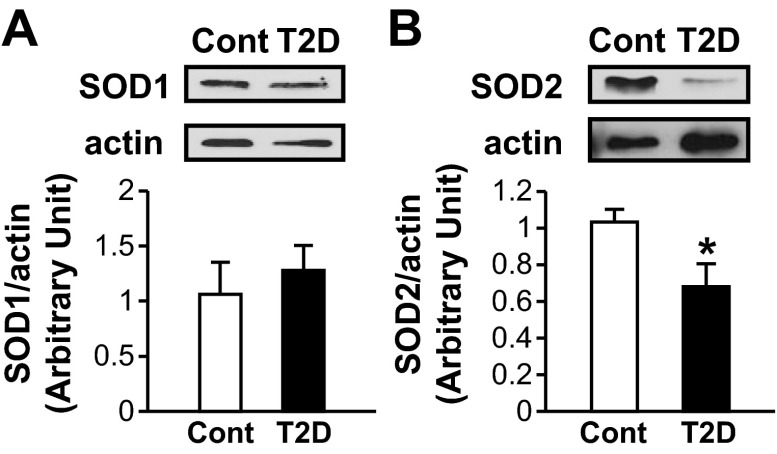
Fig. 4.
SOD2 protein expression is significantly decreased in coronary ECs isolated from T2D mice compared with controls. Top: Western blots showing SOD1 (A) and SOD2 (B) and actin protein levels. Actin was used as a loading control. Bottom: SOD1 and SOD2 protein levels normalized by actin. Values are means ± SE; n = 4 Cont and 4 T2D (A) and n = 8 Cont and 9 T2D (B). *P < 0.05 vs. Cont.

