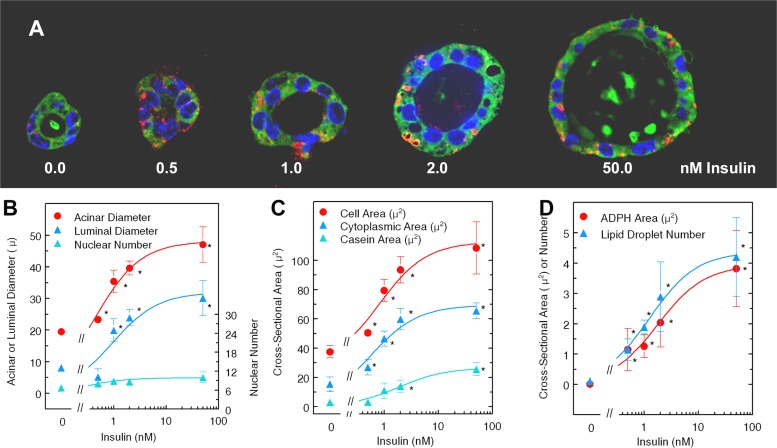
Fig. 5.
Effect of insulin on properties of acinar cultures. A: representative three-dimensional (3D) acini cultured with designated insulin doses. Acini were fixed and sectioned as in materials and methods and stained with antibodies to adipophilin (ADPH, red), casein (green), and DAPI for nuclei. B, C, and D: Slidebook analysis of acini cultured for 7 days with growth medium followed by culture in differentiation medium (see materials and methods for composition) at concentrations of insulin from 0 to 50 nM. Each point represents the mean parameters from three to five acini. Each parameter was fit to the Michaelis-Menton equation using the curve fit function of SlideWrite. The best-fitting parameters (Table 2) were then used to plot the lines shown. B: acinar and luminal diameters and no. of nuclei. Diameters were measured using the ruler function of Slidebook. Nuclei were counted by hand from the DAPI-stained structures. C: cell, cytoplasmic, and casein areas. Cell areas were calculated from the equation area = {[(DA/2)2 × π] − [(DL/2)2 × π]}/N where DA is the acinar diameter, DL is the luminal diameter, and N is the no. of nuclei in that acinus. Cytoplasmic area was defined as the total area of green stain that did not overlap with DAPI-stained nuclei, and the casein area was defined as the area of high-intensity green stain. Luminal stain was not always present, and, when it was, it was not included in these calculations. D: ADPH area or no. of particles stained for ADPH (red) as calculated by the count and area functions of Slidebook. *Mean value differs from mean at 0 nM insulin, P < 0.05.

