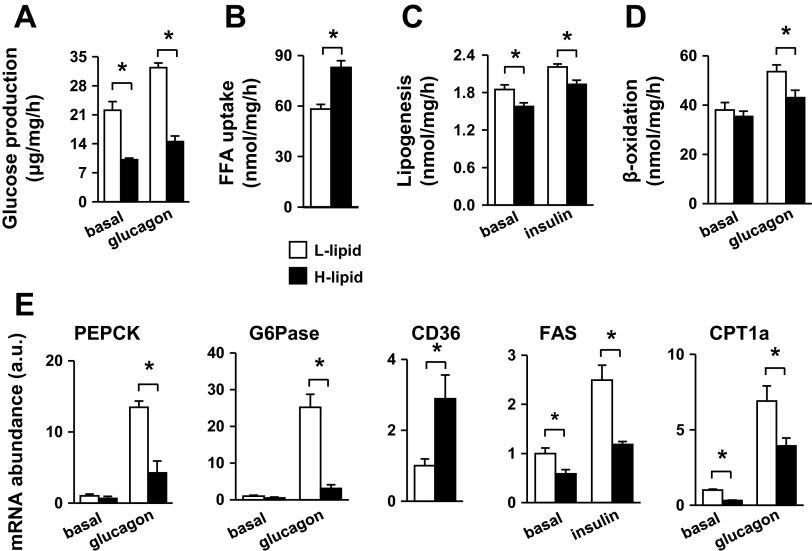
Fig. 2.
L-lipid and H-lipid subpopulations have different metabolic profiles. A: primary hepatocytes were treated without (basal) or with 50 nM glucagon. Glucose production was measured and normalized to total protein levels (n = 5). Fatty acid uptake (B), lipogenesis rates (C), and fatty acid β-oxidation rates (D) were measured and normalized to total protein levels (n = 5). E: expressions of indicated genes were measured by qPCR and normalized to 18S expression (n = 5). B–D: hepatocytes were stimulated with 50 nM glucagon or 100 nM insulin for 12 h. E: cells were treated with insulin or glucagon for 2 h (PEPCK, G6Pase) or 4 h (CD36, CPT-1a, FAS). Values are presented as means ± SE. *P < 0.05.

