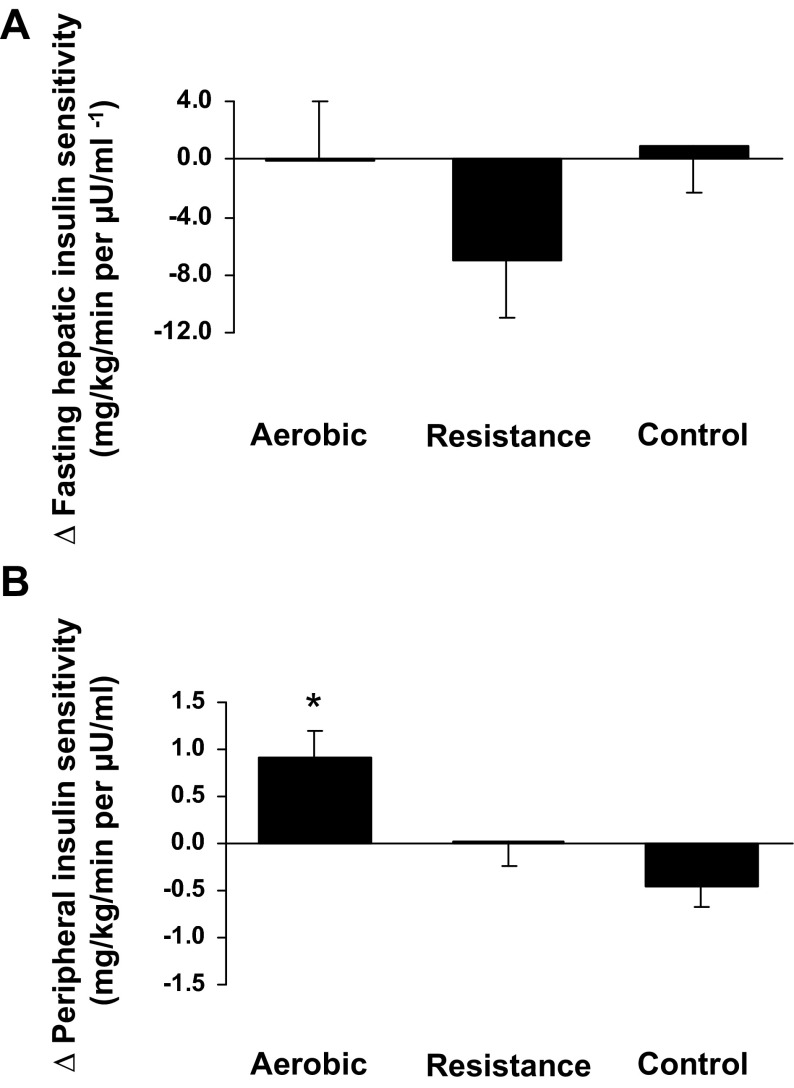
Fig. 2.
Absolute change in hepatic insulin sensitivity and peripheral insulin sensitivity for each intervention group. Values for the control group are imputed means (SE). Change values for the intervention groups are the difference compared with control, with adjustment for baseline values as assessed using ANCOVA. *P < 0.001 compared with the control group.

