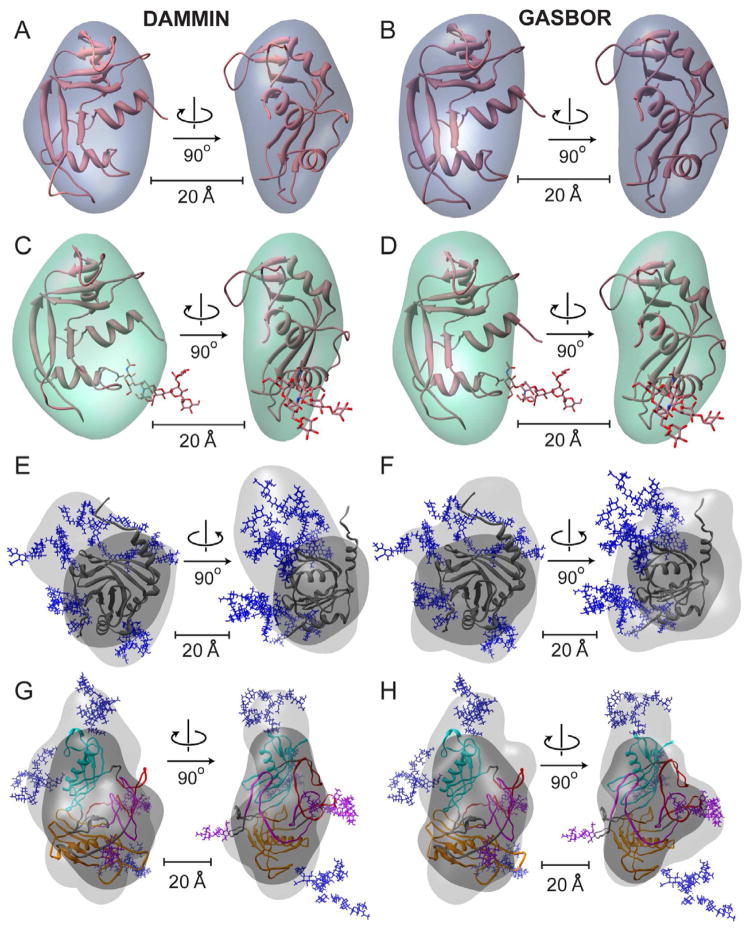
Figure 3.
Shape reconstructions of RNAseA (A, B), RNAseB (C, D), a1AGP (E, F) and Fetuin (G, H) with averaged DAMMIN (left) and GASBOR (right) models shown. Fits are shown in Figure S3. The envelopes were scaled to the measured Porod volume (listed in Table S2). For each protein the best (lowest χ) all-atom model was docked into both enantiomers of the final ab initio shape envelopes using SITUS, only the better enantiomer is shown (Wriggers and Birmanns, 2001). A–D) All-atom models RNAseA and RNAseB are shown as cartoons with glycans as sticks. E–H) The shape reconstructions calculated for the full glycoprotein (light gray) and only the protein substructure alone (dark gray) are shown for a1AGP (E, F) a1AGP and Fetuin (G, H) with N-linked glycans shown as blue sticks. The domains of Fetuin are colored as described in Figure 2, with O-linked glycans shown as purple sticks.

