Fig. 4.
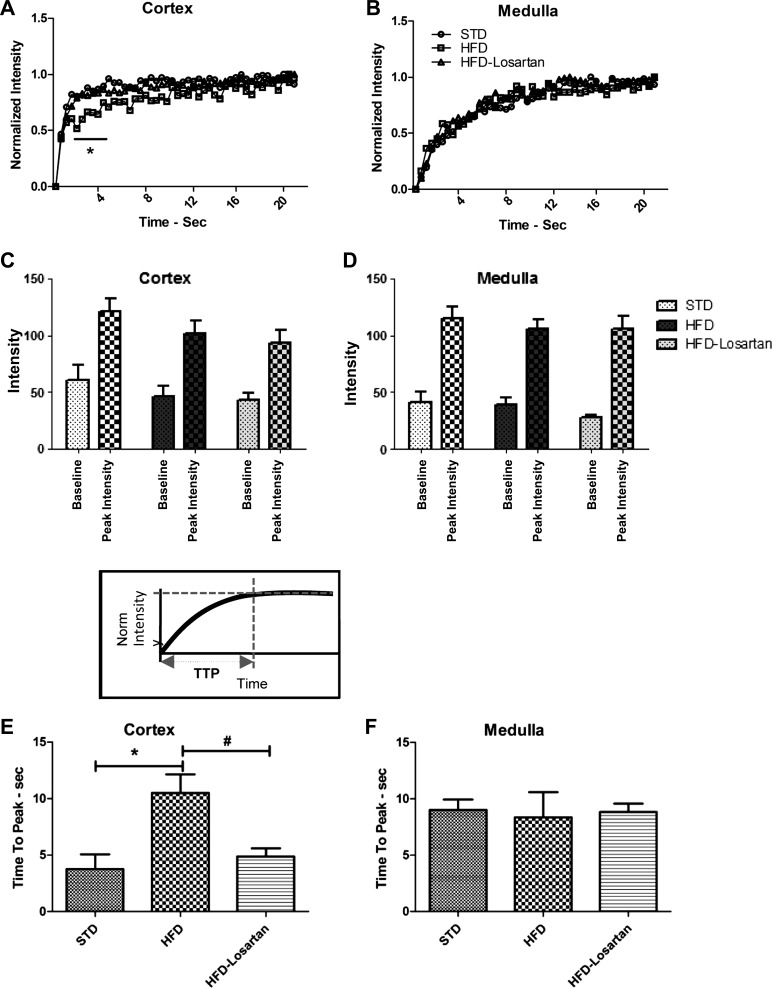
Time-intensity analysis. Representative normalized time-intensity curves from renal cortex (A) and medulla (B) in mice fed a STD (○), HFD (), or HFD after losartan treatment (△). Raw intensity data without baseline subtraction nor normalization for each mouse cohort is shown for the cortex (C) and medulla (D). Quantitative analysis of the time-to-peak (TTP) of cortex (E) and medulla (F) in STD, HFD, or HFD-losartan. Values are means ± SE; n = 6–8 in each group. Statistical analyses were performed by two-way ANOVA followed by Newman-Keuls: *P ≤ 0.05 vs. STD and HFD + losartan (A and B) and a one-way ANOVA followed by Newman-Keuls: *P ≤ 0.05 vs. mice on STD and #P ≤ 0.05 vs. mice on HFD (E and F).

