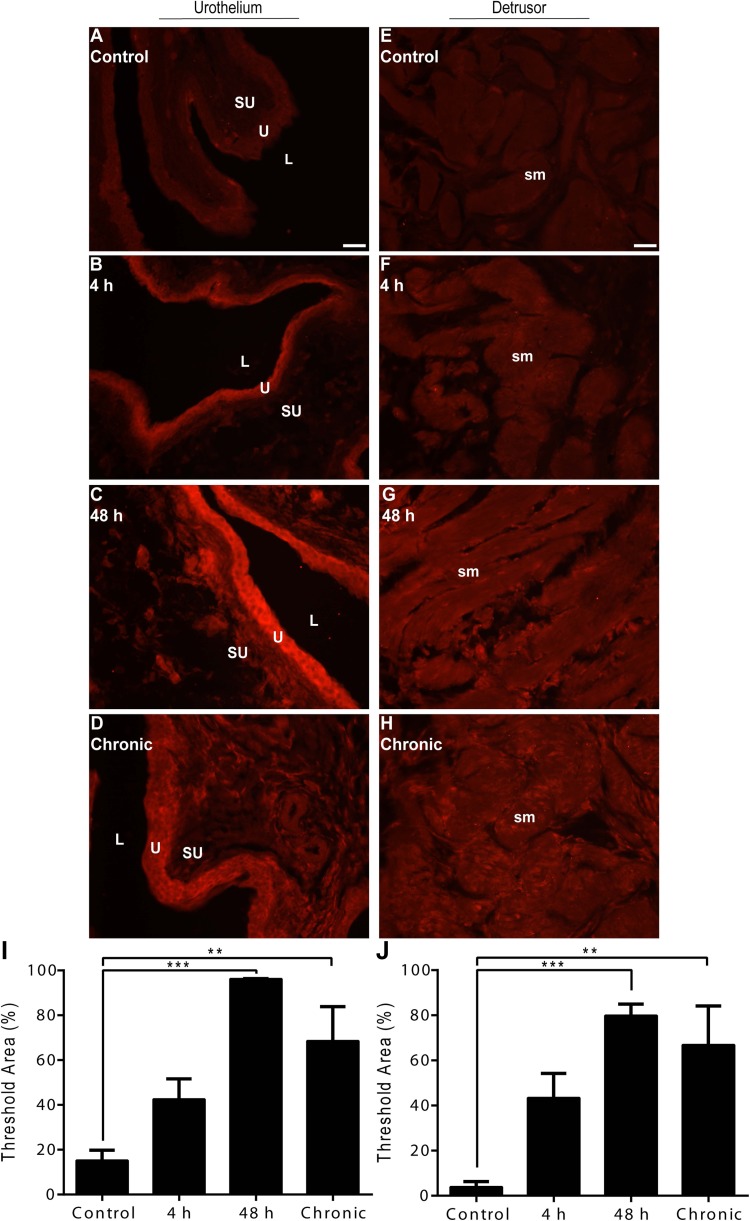
Fig. 5.
Time- and tissue-dependent regulation of TβR-2-IR following CYP treatment. A–D: representative images of TβR-2-IR in the urothelium following control or CYP treatment paradigms. E–H: representative images of TβR-2-IR in the detrusor smooth muscle following control or CYP treatment paradigms. I: semiquantitative analyses in the urothelium revealed a significant suprathreshold increase following intermediate (48 h) or chronic CYP-induced cystitis. J: semiquantitative analyses in the detrusor smooth muscle revealed a significant suprathreshold increase following intermediate (48 h) or chronic CYP-induced cystitis. Calibration bar represents 25 μm. Values are means ± SE; n = 4/condition. **P ≤ 0.01, ***P ≤ 0.001 vs. control.

