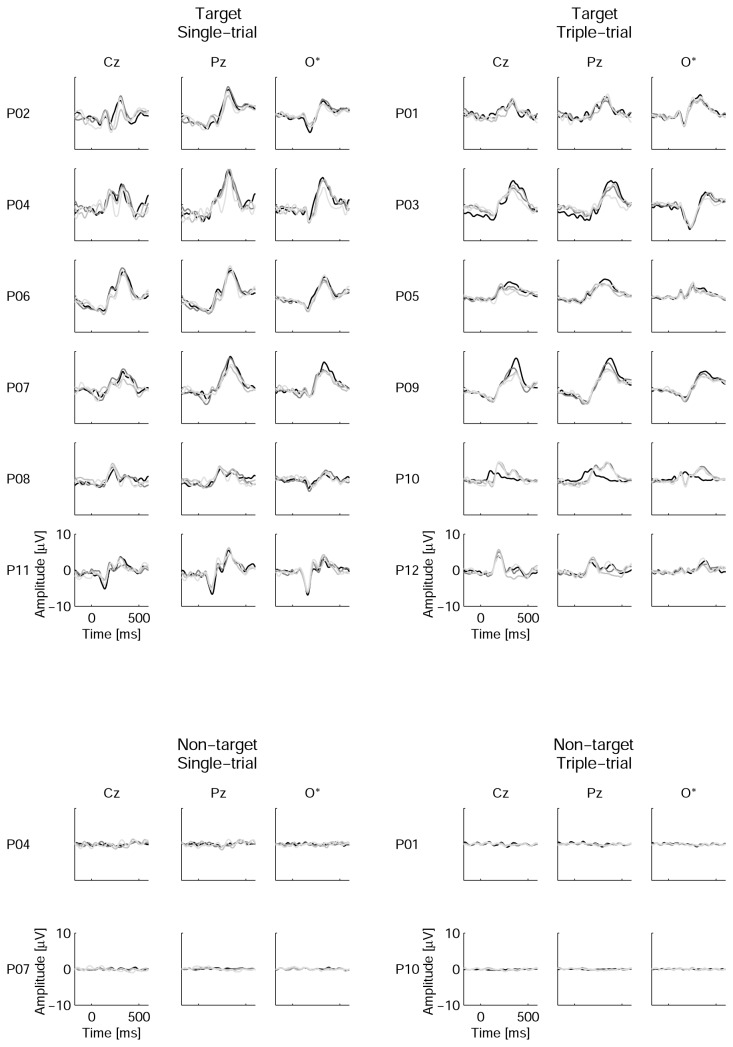
Figure 6. Individual averaged event-related potentials.
For non-target ERPs, only data from representative participants are shown (P04 and P01 had relatively high-amplitude averaged responses to non-targets, whereas P07 and P10 represented those with especially low-amplitude non-target-related averages). O* denotes an average of four occipital channels (PO7, PO8, O1 and O2). Zero time corresponds to the beginning of the stimulus. Waveforms are presented in black for the 1st session and in dark, medium and light gray for sessions 2,3 and 4, respectively.

