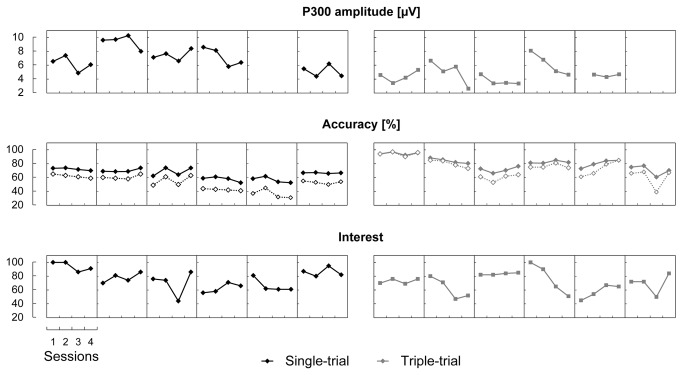
Figure 8. Dynamics of the individual index values across the four sessions.
Each circle depicts the index value per session and participant. Lines connect the index values for each separate participant. For classification accuracy, overall accuracy data are shown by empty diamonds connected by dotted lines, and corrected accuracy data are shown by filled diamonds connected by solid lines. P300 amplitude data could not be measured for two participants or during one session for another participant.

