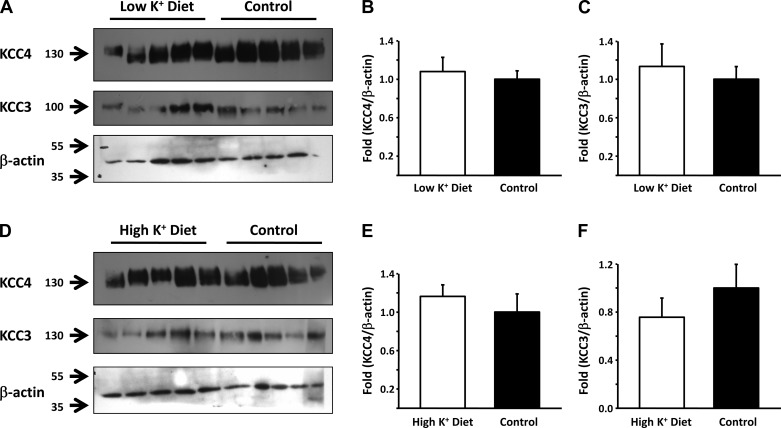
Fig. 9.
Effect of low- and high-K+ diets in KCC3 and KCC4 expression in the mouse kidney. A: Western blot analysis of KCC3 and KCC4 in whole kidneys of mice fed a control (n = 5) or low-K+ (n = 5) diet. Blots were exposed to anti-KCC3 or anti-KCC4 antibodies, and anti-β-actin used as a loading control. B and C: densitometric analyses of the KCC4 (B) and KCC3 (C) blots shown in A. D: Western blot analysis of KCC3 and KCC4 in whole kidneys of mice fed a control (n = 5) or high-K+ (n = 5) diet. Blots were exposed to anti-KCC3 or anti-KCC4 antibodies, and anti-β-actin used as a loading control. E and F: densitometric analysis of the KCC4 (E) and KCC3 (F) blots shown in D.

